What Could Explain Soybeans’ Low Stock-to-Use Ratio?
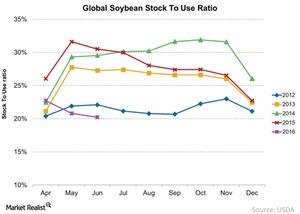
In June 2016, the global soybean stock-to-use ratio stood at 20.2%, which was at its lowest point compared to the past four years.
July 12 2016, Updated 5:05 p.m. ET

Soybeans’ stock-to-use
So far in this series, we have discussed the global stock-to-use ratio for corn and wheat, which are two of the most important crop commodities globally. With soybeans, these three comprise the largest fertilizer-consuming crops globally.
Let’s look at the soybean stock-to-use ratio for June 2016 and how it has trended over the years.
Ratio bottoms
In June 2016, the global soybean stock-to-use ratio stood at 20.2%, which was at its lowest point compared to the past four years, as shown in the chart above. This is unlike the position for corn and wheat, which have higher stock-to-use ratios compared to their respective previous four years.
Soybean inventory
With the global soybean stock-to-use ratio hitting its lowest point, we must look at what’s happening on its inventory front. According to the USDA, global soybean inventory stood at 66 million metric tons in 2016, which was about 29% lower than the previous year’s inventory of 93 million metric tons.
While the global soybean inventory is significantly smaller year-over-year, it stood at 82 million metric tons in 2014 and 75 million metric tons in 2013.
About 15% of Monsanto’s (MON) revenue in 2015 came from soybean seeds and traits, and about 39.7% of revenue came from corn seeds and traits. In 2015, about 12% of Syngenta’s (SYT) revenue came from its Corn and Soybean Seeds business.
Investors in these companies (NANR), as well as fertilizer companies such as Intrepid Potash (IPI) and CF Industries (CF), must track these two commodities and their prices.
In the final article of this series, we’ll discuss soybean prices.
