Why ExxonMobil’s Valuations Are Higher Than Historical Averages
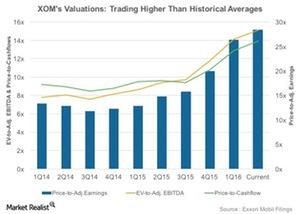
ExxonMobil’s price-to-earnings (or PE) ratio has generally shown an uptrend in the past two years. In 1Q16, the stock traded at a PE of 26.4x.
June 29 2016, Updated 9:05 a.m. ET

ExxonMobil’s valuations
ExxonMobil (XOM) traded at an average adjusted PE (price-to-earnings ratio) of 15.6x from 1Q14 to 1Q16.
ExxonMobil’s PE ratio has generally shown an uptrend in the past two years. In 1Q16, the stock traded at a PE of 26.4x. In the past few quarters, XOM saw its profits squeezed due to lower upstream earnings. The situation has been similar for XOM’s peers YPF (YPF), Chevron (CVX), and PetroChina (PTR).
The steeper fall in XOM’s earnings compared to the fall in its stock price resulted in a rise in its PE ratio. It currently trades at a PE of 28.4x, much higher than its historical average.
ExxonMobil’s EV-to-EBITDA and price-to-cash flow
From 1Q14 to 1Q16, ExxonMobil’s EV-to-adjusted EBITDA and price-to-cash flow ratios stood at averages of 9.5x and 9.7x, respectively. In the past few quarters, XOM saw lower EBITDA, which translated into lower earnings and subdued cash flows from operations. This resulted in higher valuations.
Currently, XOM is trading at EV-to-EBITDA and a price-to-cash flow ratios of 15.1x and 13.9x, respectively—higher than its historical valuations.
If you’re looking for a portfolio made up of large-capitalization companies, you can consider the PowerShares Dynamic Large Cap Value ETF (PWV). The ETF also has ~11% exposure to energy sector stocks.
Why does ExxonMobil trade at higher valuations?
In the past two years, especially in 2015, XOM’s earnings have fallen steeply compared to the fall in its stock price. This means that the majority of investors are holding on to the stock despite the turmoil in the oil and gas industry. This is likely due to investors’ faith that XOM will sail through the low energy price cycle less scathed than its peers.
