Comparing Wells Fargo and Bank of America’s Profitability
In 1Q16, Wells Fargo’s revenue grew 4% to $22.2 billion. Bank of America’s (BAC) revenue fell 7% YoY (year-over-year) to $19.5 billion.
June 13 2016, Updated 9:07 a.m. ET

Revenue comparison
In 1Q16, Wells Fargo’s (WFC) revenue grew 4% to $22.2 billion. Bank of America’s (BAC) revenue fell 7% YoY (year-over-year) to $19.5 billion.
Net interest margins
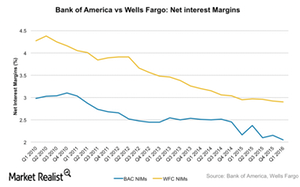
Wells Fargo’s net interest income increased by 6% to $11.7 billion. However, its net interest margin declined by 2 basis points YoY to 2.9% due to variable income sources. Meanwhile, Bank of America’s net interest income declined 3% to $9.1 billion. Its net interest margins fell 11 basis points to 2.1%. In comparison, Citigroup (C) reported net interest margins of 2.9%—flat YoY.
Major banks’ (XLF) net interest margins have been at historical lows because the Fed maintained near-zero policy rates. The net interest margin is an important operating metric for banks. It’s measured as the spread between the interest income received by banks and the interest paid out to customers on deposits as a percentage of their interest-earning assets.
Profitability ratios
Wells Fargo has long been one of the most profitable big banks (IYF) in the US. It turned in a 1.3% return on assets last year. JPMorgan Chase generated a return on assets of 0.99%.
In 2015, Bank of America generated a return on assets of 0.74%. This was lower than its target of 1%. It generated $15.9 billion in profits. In 1Q16, Bank of America generated a return on assets of 0.5%. Its earnings were hit by weak trading and investment banking revenue.
