What Are American Airlines’ Major Revenue Drivers?
American Airlines’ (AAL) capacity growth is one of the slowest in the industry. However, it has the highest capacity among its peers.
June 21 2016, Updated 9:04 a.m. ET

AAL’s revenue drivers
An airline can increase its revenues in three ways: increasing capacity, improving utilization, and increasing ticket prices. Let’s take a look at these in detail.
Capacity growth
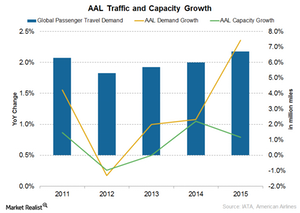
American Airlines’ (AAL) capacity growth is one of the slowest in the industry. However, you should keep in mind that AAL has the highest capacity among its peers. Since the merger, AAL’s capacity growth has averaged 1.7%. Prior to the merger, capacity growth was very volatile with -7% in 2009, 1% in 2010 and 2011, and -1% in 2012.
Traffic growth
AAL’s traffic growth of 1.7% has closely matched its capacity growth. However, it’s much slower than the industry’s, as you can see in the above graph. In 2015, AAL’s traffic grew only 2.4% compared to global passenger travel demand growth of 6.7%. Prior to the merger, its traffic growth averaged 1%–2%.
Improving capacity utilization
As a result of traffic growth closely tracking capacity growth, AAL’s capacity utilization improved by 1 percentage point to 83% in 2015. In absolute terms, it’s lower than legacy peers United Continental (UAL), Delta Air Lines (DAL), and Alaska Air (ALK) with load factors of 83.5%, 84.9%, and 84.1%, respectively.
Yields lag
Yield is the revenue earned per seat mile. Increasing competition, especially from low-cost carriers, has increased pressure on airfares. As airfares declined, yields across the industry also declined.
After increasing from 16.5 cents in 2013 to 17 cents in 2014, AAL’s yield declined to 15.9 cents in 2015. However, in absolute terms, its yield is still one of the highest in the industry, second only to UAL.
Revenue growth
As expected from the above drivers, AAL’s revenue growth has also been quite lackluster. Revenue declined by 4% in 2015 to $41 billion. Although not strictly comparable, revenue growth was an average of 4.7% in the ten years prior to the merger.
You can gain exposure to airlines by investing in the PowerShares Dynamic Leisure & Entertainment ETF (PEJ), which invests ~30% in airline stocks.
In the next part, we’ll look at American Airlines’ major costs.
