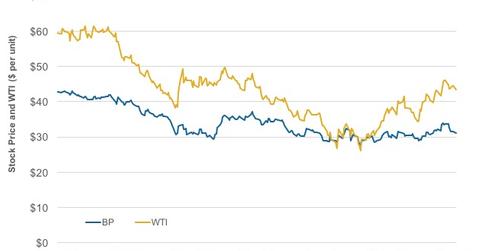
How Do BP’s Stock and Crude Oil Prices Correlate?
To what degree are integrated energy companies such as BP affected by volatility in crude oil prices? This varies from company to company.
May 27 2016, Updated 11:05 a.m. ET

What is a correlation coefficient?
In this series, we’ve analyzed BP’s (BP) stock movements, business segments, leverage, cash flow, and valuations. In this final part of our series, we’ll test the correlation between BP’s stock and crude oil prices.
A correlation coefficient shows the relationship between two variables. A correlation coefficient value of 0 to 1 shows a positive correlation, 0 shows no correlation, and -1 to 0 shows an inverse correlation. We’ve considered the past 12-month price histories of BP and WTI (West Texas Intermediate).
BP and crude oil
To what degree are integrated energy companies such as BP affected by volatility in crude oil prices? This varies from company to company. BP’s correlation coefficient with WTI stands at 0.66. This shows a strong positive correlation. It also means that on average, 66% of BP’s stock price movement can be explained by changes in WTI prices.
The strength of this correlation is lower for BP’s peer ExxonMobil (XOM). The correlation of XOM with WTI stands at 0.54. Other integrated energy players Statoil (STO) and Suncor Energy (SU) show higher correlations with WTI at 0.72 and 0.69, respectively.
On the other hand, standalone downstream companies show feeble correlations with crude oil prices. One example is Tesoro (TSO), a refiner with a 0.21 correlation with WTI.
If you’re looking for exposure to the overall energy sector, you can consider the iShares U.S. Oil & Gas Exploration & Production ETF (IEO). The ETF has ~75% exposure to the oil and gas exploration sector, ~22% exposure to the refining sector, and ~3% exposure to the oil and gas storage and transportation sector.
