What’s Been Driving Diamondback Energy’s Stock Price Movement?
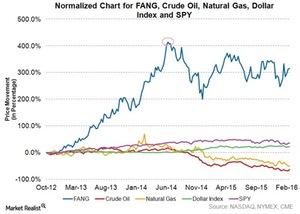
Diamondback Energy’s stock price saw uptrend from October 2012 to June 2014. When NYMEX WTI crude oil started falling in June 2014, FANG’s stock peaked.
Dec. 4 2020, Updated 10:53 a.m. ET

Identifying key drivers
In this final part, we’ll study Diamondback Energy’s (FANG) stock price movement with respect to energy prices, the dollar index, and the broader market.
As seen in above graph, FANG’s stock price was in a massive uptrend from October 2012 to June 2014, when NYMEX WTI (West Texas Intermediate) crude oil prices were also in an uptrend. NYMEX WTI crude oil started its decline in June 2014, and that’s when even FANG’s stock topped. Since then, NYMEX WTI crude has been in a downtrend, whereas FANG is consolidating in a range of $95–$50.
Clearly, crude oil is a key driver behind the movements in FANG’s stock price. Since their peaks in June 2014, WTI crude oil and FANG have lost ~69%, and ~19% of their values, respectively.
By comparison, Pioneer Natural Resources (PXD), Cimarex Energy (XEC), and Occidental Petroleum (OXY) were down by ~51%, ~42%, and ~37%, respectively, during the same period.
Effects of stronger dollar and the broader market
As seen in the above graph, there’s an inverse relationship between FANG’s stock price and the dollar index movements. Please note that a stronger dollar weakens energy prices, which affects FANG’s earnings.
Notably, in 2015, FANG outperformed the S&P 500 ETF (SPY) because FANG gained by ~12%, whereas the S&P 500 was almost flat during the same period.
FANG, in conclusion
FANG has excellent quality oil and gas reserves, with very low-cost production capacity. Also, FANG has a relatively better balance sheet than its peers. One factor that is not in FANG’s favor, however, is its smaller hedge positions for 2016 when compared with total production volumes. Given all these factors—and the fact that energy prices are in a downtrend—if energy prices move further down, FANG will be at risk to reductions in its earnings.
For ongoing analysis, keep checking in with Market Realist’s Energy and Power page.
