Correlation Analysis: Shell and Oil Price
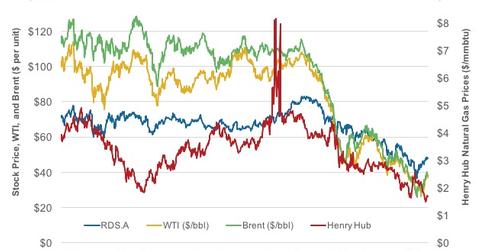
Shell’s stock price has largely moved in-line with crude oil prices. This is reflected in the results of a correlation test.
April 5 2016, Updated 1:04 a.m. ET

What is a correlation coefficient?
In this series, we’ve discussed Royal Dutch Shell’s (RDS.A) divestment plan, its Motiva asset division, its stock’s rise above its 50-day moving average, its restructured project portfolios, its leverage and cash flow position, and its trading at a premium to its historical valuations. We’ve also examined how Shell compares to its peers.
In this concluding part, we’ll test the correlation between Shell’s stock, crude oil, and natural gas prices.
A correlation coefficient shows the relationship between two variables. A correlation coefficient value of 0 to 1 shows a positive correlation, 0 shows no correlation, and -1 to 0 shows an inverse correlation. We’ve considered the past five years of price history for Shell, Brent, WTI (West Texas Intermediate), and Henry Hub natural gas prices.
Shell and oil price
Shell’s stock price has largely moved in-line with crude oil prices. This is reflected in the results of a correlation test. The correlation coefficients of Shell versus WTI, Brent, and Henry Hub natural gas prices stand at 0.83, 0.79, and 0.60, respectively. This means that an average of around 74% of movement in Shell’s stock price can be explained by changes in oil and natural gas prices.
The situation remains the same for Shell’s peers BP (BP) and Chevron (CVX), whose correlations to Brent stand at 0.62 and 0.57, respectively. However, the correlation of ExxonMobil’s (XOM) stock versus Brent stands lower, at 0.30. The iShares Global Energy ETF (IXC) has ~57% exposure to integrated energy sector stocks.
On analyzing a standalone downstream company, we can see that correlation to oil price is even stronger than with an integrated energy company. A case in point is Valero Energy (VLO), a refiner with a -0.71 correlation with Brent. This shows that refiners’ stock prices have moved inversely compared to oil prices.
