How Was Market Demand for the 13-Week Treasury Bill Auction?
The U.S. Department of the Treasury conducted the weekly auction of 13-week Treasury bills on February 16, 2016. The total issuance was worth $37 billion.
Feb. 23 2016, Updated 8:07 a.m. ET

13-week Treasury bill auction
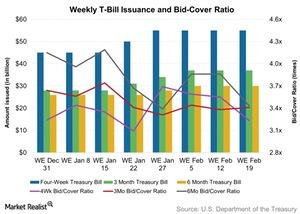
The U.S. Department of the Treasury conducted the weekly auction of 13-week Treasury bills (or T-bills) on February 16, 2016. The total issuance was worth $37 billion, the same as in the previous three weeks.
Overall auction demand as represented by the bid-to-cover ratio rose marginally, by 0.9% compared to a week ago. The bid-to-cover ratio rose from 3.38x a week ago to 3.41x on February 16.
Mutual funds such as the Oppenheimer Limited-Term Government Fund Class A (OPGVX) and the John Hancock Government Income Fund Class A (JHGIX) have exposure to T-bills.
Yield analysis
T-bills don’t pay a coupon. They are offered at a discount to face value and are redeemable at par on maturity. The high discount rate for the February 16 auction came in at 0.30%, lower than 0.32% from one week ago.
Market demand barely moved
Market demand nudged up for 13-week Treasury bills from 42.5% in the previous week to 42.6% last week. The share of indirect bids rose to 33.2% of accepted bids from 31.0% a week ago. Indirect bids depict demand from foreign central banks.
Direct bids, which had formed 11.5% of accepted bids in the previous week, fell to 9.4%. Direct bidders include domestic money managers such as State Street (STT) and BlackRock (BLK).
Due to slightly higher market demand, the share of primary dealer bids fell marginally to 57.4% from 57.5% in the previous week. Primary dealers are a group of 22 broker-dealers authorized by the Fed. They’re obligated to bid at US Treasury auctions and take up excess supply. They include companies such as Goldman Sachs (GS) and Citigroup Global Markets (C).
