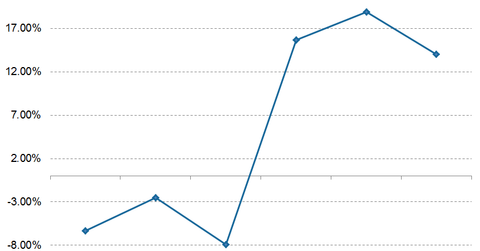
FDN Sees Huge Fund Inflows in Trailing 12-Month Period
In the trailing 12-month period, net fund inflows were $2.3 billion. FDN’s fund flows in the trailing one week and trailing three months were -$105.7 million and $719.3 million, respectively.
Dec. 4 2020, Updated 10:53 a.m. ET

Overview of FDN
The First Trust Dow Jones Internet Index Fund (FDN) tracks a market-cap-weighted portfolio of liquid US Internet companies. FDN tracks the performance of 40 publicly listed companies in the technology sector.
FDN’s market capitalization is $4.2 billion with an expense ratio of 0.57% and average daily volume of shares traded of $56.8 million. Its price-to-earnings ratio is 63.07x. Its price-to-book ratio and distribution yield stand at 5.60x and 0.00%, respectively.
FDN’s top five holdings are Amazon (AMZN) at 11%, Facebook Class A Shares (FB) at 10.4%, Alphabet Class A (GOOGL) at 5.4%, Salesforce.com at 5.3%, and Alphabet Class C (GOOG) at 5.3%. These companies make up more than 37% of FDN’s total portfolio. Amazon (AMZN) comprises 5.3% of the Power Shares QQQ ETF (QQQ) as well.
Fund flows in FDN
In the trailing one month, fund outflows for the First Trust Dow Jones Internet Index Fund (FDN) were $246.2 million. In the trailing 12-month period, net fund inflows were $2.3 billion. FDN’s fund flows in the trailing one week and trailing three months (quarterly) were -$105.7 million and $719.3 million, respectively.
FDN generated investor returns of 15.7% in the trailing 12-month period and -6.3% in the trailing one-month period. In comparison, it generated 18.9% returns in the trailing three-year period, -7.9% year-to-date, and -2.5% in the last three months.
Moving averages
On January 19, 2016, FDN closed the trading day at $64.94. Based on this figure, here’s how the stock fares in terms of its moving averages:
- 9.8% below its 100-day moving average of $71.93
- 12.3% below its 50-day moving average of $74.03
- 8.9% below its 20-day moving average of $71.35
