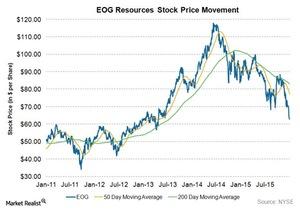
EOG Resources Failed to Hold above Its 200-Day Moving Average
In 3Q15, excluding the one-time items, EOG reported a profit of $0.02 per share, $0.32 better than the analyst consensus for a loss of $0.30 per share. Its revenues fell ~58% year-over-year to ~$2.17 billion.
Jan. 19 2016, Updated 10:55 a.m. ET

EOG Resources’ downtrend and 200-day moving average
Declining crude oil and natural gas prices over the last 18 months are dragging the entire upstream sector into a downtrend. As seen in the chart below, EOG Resources (EOG) is decidedly trading below its 50-day moving average as well as its 200-day moving average by ~17% and ~24%, respectively.
EOG’s stock price is in a downtrend, where it is making a clear pattern of lower highs and lower lows.
EOG’s stock price broke the 200-day moving average in September 2014. Since then, EOG tried to regain its 200-day moving average in April and November 2015, but it failed to hold above it.
EOG’s weakness
EOG has shown less relative strength and has been sold off when compared with other upstream stocks. Its weakness is evident in its ~23% decline in 2015.
Other large oil and gas producers from the S&P 500 Index (SPY) include Occidental Petroleum (OXY), Cimarex Energy (XEC), and Pioneer Natural Resources (PXD). These companies fell ~13%, ~15%, and ~16%, respectively.
EOG’s 3Q15 earnings
In 3Q15, excluding the one-time items, EOG reported a profit of $0.02 per share, $0.32 better than the analyst consensus for a loss of $0.30 per share. Its revenues fell ~58% year-over-year to ~$2.17 billion.
What do these headline numbers mean? Are these numbers good or bad for EOG? Why is EOG’s stock price in a downtrend and unable to hold above its 200-day moving average? We will look at these questions in this series by studying EOG’s earnings, past events, various fundamental ratios, and key drivers for its stock price movement.
