The Downward Trend of EQT’s Free Cash Flow
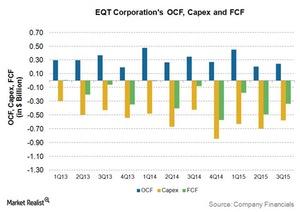
EQT has been reporting negative free cash flows since 2Q13. In 3Q15, EQT’s free cash flow was -$334 million.
Feb. 4 2016, Updated 9:05 a.m. ET

EQT’s revenues and operating cash flows
For 3Q15, EQT’s (EQT) total operating revenue was ~$416 million, or ~28% lower when compared to 3Q14. The much lower operating revenue in 3Q15 was the direct result of lower realized prices for natural gas production.
In 3Q15, EQT reported an OCF (operating cash flow) of ~$244 million. That was ~30% lower than its OCF of ~$347 million in 3Q14. This was primarily due to the lower revenues reported in the same period.
EQT’s free cash flow trend
As you can see in the above graph, EQT has been reporting negative free cash flows since 2Q13. In 3Q15, EQT reported a FCF (free cash flow) of -$334 million. Due to the steep downward trend in energy prices, free cash flows of almost all S&P 500 (SPY) energy companies have declined in 3Q15. Bigger players such as Pioneer Natural Resources (PXD), Occidental Petroleum (OXY), and Noble Energy (NBL) reported -$194 million, -$64 million, and -$23 million, respectively, in free cash flows in 3Q15.
FCF helps a company enhance shareholder value. It can be used to pay dividends, buy back stock, or repay debt. FCF is calculated by subtracting capex (capital expenditure) from OCF.
EQT’s capex
In 3Q15 and the first nine months of 2015, EQT spent a total of ~$578 million and ~$1.9 billion in capex, respectively.
For 2015, EQT expects to spend ~$2.1 billion in capex for its upstream operations and midstream operations. That’s ~13% lower when compared to its total capex of ~$2.4 billion in 2014.
