Analyzing JPMorgan Intrepid European Fund’s Allocation in 2015
The JPMorgan Intrepid European Fund’s assets were spread across 79 holdings as of December 2015.
Dec. 4 2020, Updated 10:53 a.m. ET

JPMorgan Intrepid European Fund
The JPMorgan Intrepid European Fund – Class A (VEUAX) “seeks total return from long-term capital growth. Total return consists of capital growth and current income.”
The bottom-up approach is employed while selecting securities for the portfolio. The fund’s process “focuses on the value, quality and momentum characteristics of stocks.” It is also important to note that the fund mostly invests in shares issued by companies whose activities are focused in Western Europe. The fund may invest up to 8% of its assets in securities of companies based in emerging European countries. It also makes use of exchange-traded futures in order to efficiently manage cash flows.
The fund’s assets were spread across 79 holdings as of December 2015, and it was managing assets worth $1.0 billion as of the end of December. As of December, its top ten equity holdings included Novo Nordisk (NVO), BT Group (BT), Anheuser-Busch (BUD), Imperial Tobacco Group (ITYBY), and Rio Tinto (RIO). These stocks comprised 11.3% of the fund’s portfolio.
Historical portfolios
For this analysis, we will be considering holdings as of November 2015, when the fund made available its most recent sectoral breakdown. The holdings after November reflect valuation-driven changes to the portfolio, not the actual holdings.
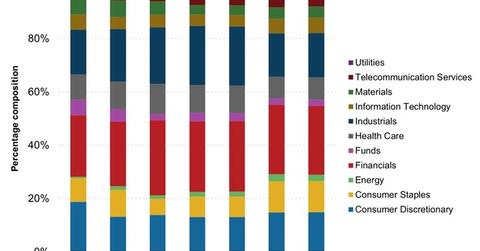
The fund has the most exposure to the financials sector, and it forms a little under a quarter of the fund’s portfolio. Industrials and consumer discretionary stocks, the fund’s second and third highest sectors, form a combined one-third of the portfolio. Consumer staples and healthcare round off the fund’s top five sectors.
A look at the graph above will show you that the fund’s management has experimented quite a bit with portfolio composition in 2015, resulting in a very high portfolio turnover rate. Let’s take the example of the consumer discretionary sector. Exposure to stocks in the sector had increased to nearly a fifth of total assets intra-year, nearly double its exposure at the beginning of 2015. However, the same now stands at 15.0%, up from a year ago, but sharply down from its weight intra-year. Except a few stock picks like ITYBY, Aviva (AV), and NVO, fund managers have not stuck to their holdings. In fact, in the energy sector, the composition is entirely different from what it was a year ago.
Almost all sectors have seen either decreased or increased exposure intra-year, and then the opposite later on in the year. Did this portfolio shuffling help the fund in 2015? Let’s see in the next article.
