Comparing Papa John’s Net Margins with Other Quick-Service Big Guns
In 2014, Papa John’s net profits as a percentage of total sales decreased by 0.2% due to increases in interest levels.
Dec. 19 2015, Updated 5:04 a.m. ET

Papa John’s bottom line
Having discussed the revenues, total costs, and expenses of Papa John’s International (PZZA), we’ll move now to the crucial question of Papa John’s net profitability over past five years, comparing its bottom line with that of its peers.
Papa John’s net margins over the past five years
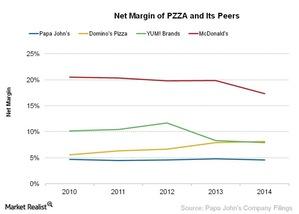
The graph above shows that over the past five years, from 2010 to 2014, the net margins of Papa John’s has not deviated much. Its net margins were 4.7%, 4.5%, 4.6%, 4.8%, and 4.6% of total sales in 2010, 2011, 2012, 2013, and 2014, respectively. Although its debt, interest to service the debt, and commodity prices have increased in the past three years, some of these effects have been mitigated by increases in same-store sales.
In 2014, net profits as a percentage of total sales decreased by 0.2% due to increases in interest levels. The interest required to service the debts has increased due to increases in debt levels as well as effective interest rates.
Papa John’s versus peers
The net margin for Domino’s Pizza (DPZ) increased from 5.6% in 2010 to 8.2% in 2014. Domino’s recorded an operating profit of 17.3% in 2014, but due to high debt levels and the interests paid to service these debts, its net profits margins declined.
The net margin of Yum! Brands (YUM), which owns Pizza Hut, decreased from 10.2% in 2010 to 7.9% in 2014. During the same period, the net margin of McDonald’s Corporation (MCD) decreased from 20.6% to 17.3%. McDonald’s makes up 4% of the total portfolio value of the Consumer Discretionary Select Sector SPDR Fund (XLY). By comparison, Papa John’s International (PZZA) makes up 2.2% of the PowerShares Dynamic Leisure and Entertainment ETF (PEJ) and approximately 2.3% of the PowerShares Dynamic Food & Beverage ETF (PBJ).
Now it’s time to assess Papa John’s debt situation.
