Key Moving Averages: Analyzing Kellogg versus Its Peers
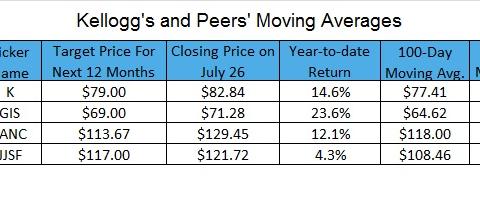
Kellogg closed at $82.84 on July 26. It’s trading 7.0%, 5.4%, and 0.4% above its 100-day, 50-day, and 20-day moving averages. It has appreciated ~15% in 2016.
Aug. 1 2016, Updated 11:04 a.m. ET

Kellogg’s moving averages
Kellogg Company (K) closed at $82.84 on July 26. It’s trading 7.0% above its 100-day moving average, 5.4% above its 50-day moving average, and 0.4% above its 20-day moving average. So far, Kellogg has appreciated ~15% in 2016.
Peers’ moving averages
Kellogg’s peers in the industry include General Mills (GIS), Lancaster Colony (LANC), and J&J Snack Foods (JJSF). On July 26, General Mills closed at $71.28—10.3% above its 100-day moving average, 6.2% above its 50-day moving average, and 0.10% below its 20-day moving average. So far, General Mills has risen ~24% in 2016.
Lancaster Colony closed at $129.45—9.7% above its 100-day moving average, 4.2% above its 50-day moving average, and 1.7% above its 20-day moving average. J&J Snack Foods is trading 12.2% above its 100-day moving average, 8.4% above its 50-day moving average, and 1.9% above its 20-day moving average. The stock closed at $121.72 on July 26.
The Guggenheim S&P 500 Equal Weight Consumer Staples ETF (RHS) invests 2.7% of its holdings in Kellogg and 2.7% of its holdings in General Mills. RHS is trading 4.2% and 2.5% above its 100-day and 50-day moving averages. It’s trading 0.22% below its 20-day moving averages, respectively. It closed at $128.57 on July 26. RHS has risen 10.8% year-to-date. Kellogg, General Mills, Lancaster Colony, and J&J Snack Foods already beat analysts’ estimates by 4.0%, 3.3%, 13.8%, and 4.0%, respectively.
