How Does Jacobs Engineering Group Compare to Its Peers?
The First Trust ISE Global Construction and Engineering ETF (FLM) invests 2.9% of its holdings in Jacobs Engineering Group.
Nov. 24 2015, Published 5:24 p.m. ET

Jacobs Engineering Group and its peers
In this article, we’ll compare Jacobs Engineering Group with its peers in terms of the following metrics:
- The PE (price-to-earnings) ratios of Jacobs Engineering Group (JEC), Fluor (FLR), and Tetra Tech (TTEK) are 15.6x, 10.5x, and 43.6x, respectively, as of November 23, 2015.
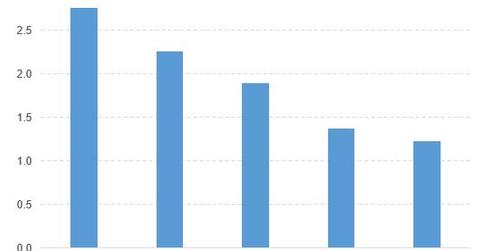
- The PBV (price-to-book value) ratios of Jacobs Engineering Group, Fluor, Aecom (ACM), KBR (KBR), and Tetra Tech are 1.2x, 2.3x, 1.4x, 2.8x, and 1.9x, respectively.
Thus, its peers have outperformed Jacobs Engineering Group based on PBV.
ETFs that invest in Jacobs Engineering Group
The First Trust ISE Global Construction and Engineering ETF (FLM) invests 2.9% of its holdings in Jacobs Engineering Group. The ETF tracks an index of global construction and engineering weighted in tiers spanning the entire market-cap spectrum.
The PowerShares Dynamic Building & Construction Sector Portfolio ETF (PKB) invests 2.8% of its holdings in Jacobs Engineering Group. The ETF tracks a quantitative index that selects building and construction companies most likely to outperform based on growth and value metrics.
The Guggenheim S&P 500 Pure Value ETF (RPV) invests 1.6% of its holdings in Jacobs Engineering Group. The ETF tracks an index of primarily large-cap, committee-selected US stocks. The index covers about 33% of the S&P 500’s market cap using three factors to select value stocks.
Comparing Jacobs Engineering Group and its ETFs
Now let’s compare Jacobs Engineering Group with the ETFs that invest in it:
- The year-to-date price movements of Jacobs Engineering Group, FLM, PKB, and RPV are -2.6%, 3.2%, 14.8%, and -4.5%, respectively.
- The PE ratios of Jacobs Engineering Group, FLM, PKB, and RPV are 15.6x, 16.7x, 49.9x, and 34.4x, respectively.
- The PBV ratios of Jacobs Engineering Group, FLM, PKB, and RPV are 1.2x, 1.5x, 2.8x, and 1.2x, respectively.
Thus, these ETFs have outperformed Jacobs Engineering Group based on price movement, PE, and PBV.
