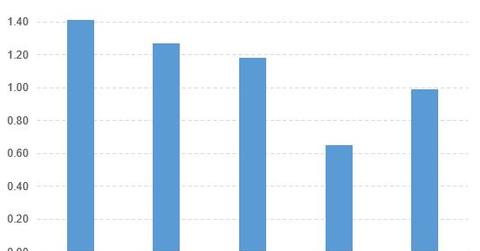
How Did Comerica Perform Compared to Its Peers?
The peers outperformed Comerica based on the PBV ratio. However, Comerica is way ahead of its peers based on the forward PE ratio.
Oct. 19 2015, Published 11:28 a.m. ET

Comerica and its peers
An analysis of Comerica and its peers follows:
- The forward PE (price-to-earnings) ratios of Comerica (CMA), Citizens Financial (CFG), BB&T (BBT), Huntington Bancshares (HBAN), and BOK Financial (BOKF) are 13.15x, 12.05x, 11.39x, 11.86x, and 13.16x, respectively.
- The PBV (price-to-book value) ratios of Comerica, Citizens Financial, BB&T, Huntington, and BOK Financial are 0.99x, 0.65x, 1.18x, 1.41x, and 1.27x, respectively.
According to the above findings, the peers outperformed Comerica based on the PBV ratio. However, Comerica is way ahead of its peers based on the forward PE ratio.
ETFs that invest in Comerica
The PowerShares KBW Bank Portfolio (KBWB) invests 2.1% of its holdings in Comerica. KBWB aims to track a market cap weighted index of US banking firms.
The Dow Jones Regional Banks Index Fund (IAT) invests 1.9% of its holdings in Comerica. IAT tracks the performance of an index of small and mid-cap regional banks.
The KBE Bank Fund (KBE) invests 1.6% of its holdings in Comerica. KBE tracks an equal-weighted index of US banking firms.
Compared Comerica and its ETFs
An analysis of Comerica and its ETFs follows:
- The YTD (year-to-date) price movements of Comerica, IAT, and KBE are -8.6%, -1.7%, and 1.6%, respectively.
- The PE ratios of Comerica, KBWB, IAT, and KBE are 13.68x, 12.58x, 13.82x, and 14.01x, respectively.
- The PBV ratios of Comerica, KBWB, IAT, and KBE are 0.99x, 1.06x, 1.23x, and 1.21x, respectively.
The ETFs outperformed Comerica based on the price movement, PE ratio, and PBV ratio.
