Importance of Spending on US GDP and Related Mutual Funds
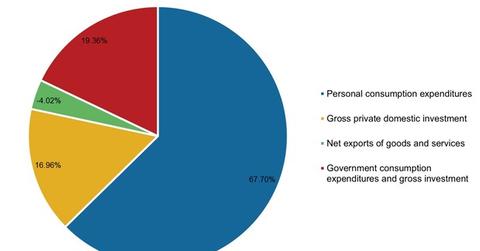
Nearly 68% of the US GDP is composed of PCE or consumer spending. The negative value of net exports shows that the United States imports more than it exports, and this eats into the total economic output.
Sept. 24 2015, Published 4:22 p.m. ET

Importance of spending
There’s been a lot of emphasis on household and business spending over the past few months. Not enough total spending is believed to be the primary reason for slower economic growth in several countries. In the United States, it was considered the primary reason behind the mere 0.6% rise in GDP (gross domestic product) in 1Q15.
The above graph shows the breakup of the US GDP into four major heads. The values are a simple average from 1Q00 to 2Q15. It shows that nearly 68% of the US GDP is composed of PCE (personal consumption expenditures) or consumer spending. The negative value of net exports shows that the United States imports more than it exports, and this eats into the total economic output.
Correlation and regression
To further take a look at the importance of personal and business spending, we did a correlation analysis of quarterly US GDP data with some of its components from 1Q00 until 2Q15. Correlation shows how strongly two variables are related to each other.
The correlation coefficient ranges from +1 to -1. A positive correlation shows that as one variable increases, the other increases as well, and vice versa. On the other hand, a negative correlation shows that as one variable increases, the other variable decreases, and vice versa. The number shows the strength of the correlation; the closer it is to 1, the stronger the correlation.
An analysis of data for the period outlined above showed that the correlation between the quarterly change in GDP and the quarterly change in PCE (personal consumption expenditure) stood at 0.91, showing a strong positive correlation. This was the same value that we received for correlation between change in GDP and change in GPDI (gross private domestic investment).
NRFI (non-residential fixed investment), which portrays business investment, is part of GPDI. Its correlation with the change in GDP stood at 0.82, which is also significant.
A regression analysis showed that 83% of the change in GDP is explained by both a change in PCE and a change in GPDI. Meanwhile, 67% of the change in GDP is explained by a change in NRFI.
Higher consumption in the United States benefits companies like Procter & Gamble (PG), McDonald’s (MCD), Walmart (WMT), and mutual funds like the Vanguard 500 Index Fund – Investor Class (VFINX) and T. Rowe Price Growth Stock ETF (PRGFX).
Though we used data for the United States, the assessment can be applied generally. Any economy would struggle to grow without spending.
In the next article, let’s put this information between spending and economic growth to use for assessing the impact of the changes in Japan’s economy on Japan-focused mutual funds.
