Why Did Vale Report a Beat on Market Expectations in 2Q15?
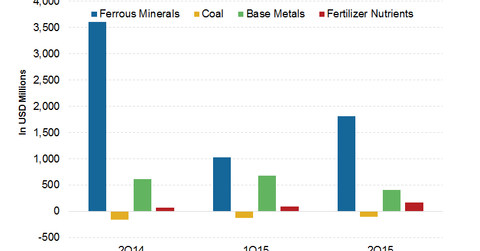
In this article, we’ll look at Vale’s (VALE) 2Q15 results and why they’re a beat on market expectations. Vale reported adjusted EPS of $0.19, which was 55% above consensus.
Aug. 6 2015, Published 4:29 p.m. ET

Vale reports 55% above EPS consensus
In this article, we’ll take a look at Vale S.A.’s (VALE) 2Q15 results and why they’re a beat on market expectations. Vale reported adjusted EPS (earnings per share) of $0.19, which was 55% above consensus.
Vale’s EBITDA (earnings before interest, taxes, depreciation, and amortization) of $2.2 billion was 14% above consensus of $1.95 billion. Vale’s EBITDA was positively impacted by lower costs and higher sales volumes. Vale reported COGS (cost of goods sold) of $5.2 billion in 2Q15, almost in line with 1Q15 and 14.7% lower year-over-year.
SG&A (selling, general, and administrative expenses) of $159 million for 2Q15 were 18.5% lower quarter-over-quarter and 33% lower year-over-year. As a percentage of sales, SG&A fell to 2.2% in 2Q15 compared to 3.1% in 1Q15 and 2.4% in 2Q14.
Lower unit costs in iron ore
Vale’s performance on iron ore realized and costs front was quite impressive. Its C1 (cash costs) fell by 14% quarter-over-quarter to $15.80 per ton. This was mainly due to cost-cutting initiatives the company undertook, depreciation of the Brazilian real, and the ramp-up of its N4WS mine.
Vale’s peer in iron ore, Cliffs Natural Resources (CLF), reported an earnings miss on lower-than-expected realized revenues in the US iron ore division. BHP Billiton (BHP) and Rio Tinto (RIO) have announced their 2Q15 production results, and earnings are slated to be released mid-August.
All listings of BHP, RIO, and Vale make up 17.8%, 11.7%, and 2.6%, respectively, of the iShares MSCI Global Metals & Mining Producers ETF (PICK). The SPDR S&P Metals and Mining ETF (XME) also invests in some of these stocks.
In the next part, we’ll see why Vale’s performance on iron ore costs was strong in 2Q15.
