How Is UPS Performing against Its Peers?
UPS has the highest sales among its peer group with $58.2 billion in sales in 2014. Rival FedEx wasn’t far behind with $47.45 billion in sales.
July 16 2015, Updated 9:05 a.m. ET

UPS vs. peers
Let’s take a look at how United Parcel Service (UPS) has performed against some of its peers.
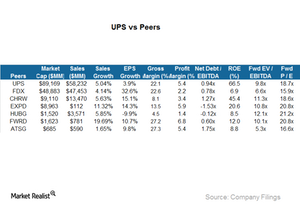
The above chart compares UPS with some of its peers. FedEx (FDX) is its closest competitor, both as a per business model and according to scale. Although Air Transport (ATSG) has a similar business model, it’s very small compared to UPS. C.H. Robinson Worldwide (CHRW), Hub Group (HUBG), and Forward Air (FWRD) are logistics providers and offer competition to UPS. UPS forms 7.6% of the iShares Transportation Average ETF (IYT).
Sales
UPS has the highest sales among its peer group. It clocked $58.2 billion in sales in 2014. Rival FedEx (FDX) wasn’t far behind with $47.45 billion in sales. Smaller rivals are growing at a much faster pace, given their smaller base. United Parcel Service (UPS) has grown by only 5% in the last year. Forward Air (FWRD) had the highest growth of 19.69%.
Margins
Despite its large scale of operations, UPS has managed to maintain margins. At gross levels, UPS margins are close to rival FDX’s. However, at a net level, UPS margins are higher. Net margins for UPS stood at 5.4% in 2014, while net margins for FDX were at 2.2%. Smaller rival ATSG and FWRD have gross margins higher than UPS’s. However, on a net margin level, they’re very close to UPS margins.
Valuation multiples
UPS is priced higher than FDX, but it’s very close to the peer group average. The average forward PE (price-to-earnings) ratio for the peer group stands at 21.5. Forward PE for UPS and FDX is 18.7 and 15.9, respectively. That makes FDX a more expensive stock. Logistic providers EXPD, HUBG, and FWRD are more expensive than UPS with forward PE ratios of 20.8, 21.2, and 20.8, respectively.
