Walmart’s Stock Performance Has Been Below Par
Stock price movement affected Walmart’s stock performance. Walmart’s stock is only up by 8.8% since the start of 2014.
March 3 2015, Updated 12:05 p.m. ET

Walmart’s returns trailed other retail companies
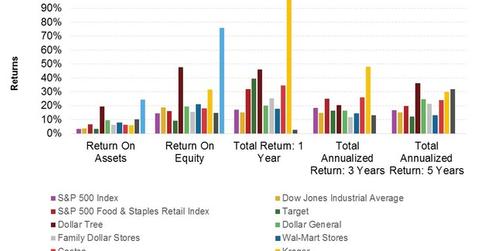
Due to the strong capitalization metrics and cash flows described in the last part of this series, Walmart (WMT) posted an above average return on equity, or ROE, and return on assets, or ROA, in its last fiscal year.
ROE is a return measure. It’s computed as the net profits earned by equity shareholders as a percentage of equity capital. ROA is calculated as net profits divided by total assets. For Walmart, both ROA and ROE are above the industry average—represented by the S&P 500 Food & Staples Retail Index.
Walmart’s returns have been below par
Despite Walmart’s strong financial position, cash flows, and capital structure—as we discussed in the last part of this series—its returns to shareholders trailed the overall industry and most of its peers over the past five years. That’s mainly due to Walmart’s stock performance since December 2013. Earnings per share, or EPS, declined year-over-year, or YoY, in three of the last four quarters.
In the past year, the company faced negative comps in key markets over several quarters. The key markets include the US, China, Mexico, Canada, and the United Kingdom.
Stock price movement
Stock price movement affected Walmart’s stock performance. Walmart’s stock is only up by 8.8% since the start of 2014. This compares unfavorably to Kroger (KR). It’s up by a whopping 84.4%. Costco (COST) and Target (TGT) are up by 25.4% and 21.7%, respectively[1. Computed through February 12, 2015]. The S&P 500 Index (SPY), the Dow Jones Industrial Average (DIA), and the S&P 500 Food & Staples Retail Index are up by 14%, 9.3%, and 27.8%, respectively.
Walmart is part of ETFs that track popular indices like the Consumer Staples Select Sector SPDR ETF (XLP) with an ~7.5% weight, the SPDR Dow Jones Industrial Average ETF (DIA) with an ~3.1% weight, and the SPDR S&P 500 ETF (SPY) with an ~0.8% weight.
Despite the below-par performance, there are several positives that Walmart shareholders can look forward to. We’ll discuss this in more detail in the next part of this series.
