Must-know: How Six Flags generates its revenues
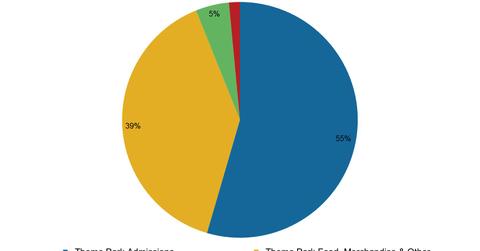
Six Flags derived 55% of its revenues from theme park admissions for the last 12 months ended September 30, 2014.
Nov. 20 2019, Updated 1:05 p.m. ET

Revenue model
Since the theme park business is highly seasonal, ~80% of Six Flags Entertainment Corp.’s (SIX) park attendance and revenues occur in the second and third calendar quarters of each year. The most significant period falls between Memorial Day and Labor Day.
Six Flags primarily derives its revenues from the following:
- the sale of tickets for admissions to its parks
- the sale of food and beverages, merchandise, games, attractions, and other services inside its parks
- sponsorship, licensing, and other fees
Revenues from ticket sales and in-park sales are driven primarily by park attendance. The above chart shows the revenue breakdown of Six Flags. Six Flags derived 55% of its revenues from theme park admissions for the last 12 months (or LTM) ended September 30, 2014.
Other theme park companies such as SeaWorld Entertainment (SEAS) and Cedar Fair (FUN) derive about 62% and 57% of their revenues, respectively, from theme park admissions.
A good way to get access to the leisure industry is to invest in ETFs such as the Consumer Discretionary Select Sector SPDR Fund (XLY) and the iShares U.S. Consumer Services (IYC).
Guest spending and revenue growth
The above chart shows Six Flags’ guest per capita spending has been increasing since 2009. For the LTM ended September 30, 2014, Six Flags’ attendance stood at 25.1 million with guest per capital spending of $42.9.
Six Flags’ revenues grew at a compounded annual growth rate (or CAGR) of 5.0% over the four-year period since 2009. Revenues for the LTM ended September 30, 2014, stood at $1,146 million.
