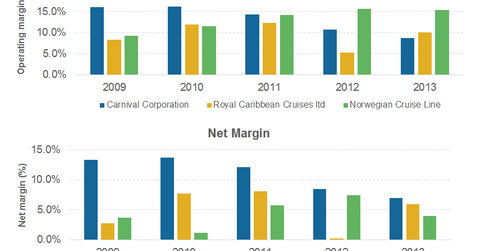
Comparing the major cruise lines’ operating and net margins
Among the three major competitors in the cruise industry, Royal Caribbean (RCL) had the highest operating margin in 2013.
Jan. 27 2015, Updated 2:22 p.m. ET

Operating margin
Among the three major competitors in the cruise industry, Royal Caribbean (RCL) had the highest operating margin in 2013 after it doubled its operating margin to ~10% from ~5% in 2012. Its competitors’ margin decreased during the year. All cruise operators incurred higher unit costs in 2013. Royal Caribbean’s operating margin was driven by higher yield and occupancy, which shows that demand for the company’s cruises was strong despite higher prices.
Carnival Corporation’s (CCL) operating margin is generally higher than Royal Caribbean’s. But with lower occupancy and a fall in yield, combined with high unit costs in 2013, the company’s margin decreased to ~9% from ~11%. Other competitor Norwegian Cruise’s (NCLH) operating margin also decreased slightly in 2013.
The PowerShares Dynamic Leisure and Entertainment Portfolio (PEJ), the PowerShares Dynamic Large Cap Growth Portfolio (PWB), and the Consumer Discretionary Select Sector SPDR Fund (XLY) hold shares of these cruise lines.
Net margin
A company’s competitive advantage is also affected by its capital structure. Other than operational efficiency, net financial expenses have a significant impact on net margin and earnings per share (or EPS). Norwegian, for example, had the highest operating margin of 15.4% in 2013, but due to high leverage, its net margin was only 4%—the lowest among the three companies.
Similarly, even though Royal Caribbean’s efficient operations generate higher operating margins, because of higher leverage, its net margin in 2013 was 6%—lower than Carnival Corporation’s 7%. Carnival Corporation, with the lowest debt as a percentage of its total capital, incurs an interest expense of just ~2% of its revenue. Meanwhile, Royal Caribbean incurs an interest expense of ~4% of revenue and Norwegian is even higher at ~11% of revenue.
We’ll discuss the leverage of these three major cruise operators in Part 11 of this series.
