A closer look at Royal Caribbean’s revenue sources and growth
Royal Caribbean (RCL) derives revenue from two sources: passenger ticket revenue and onboard and other revenue.
Jan. 22 2015, Updated 4:22 p.m. ET

Revenue source and growth trend
Royal Caribbean (RCL) derives revenue from two sources: passenger ticket revenue and onboard and other revenue. Passenger ticket revenue includes revenue from selling passenger tickets for various cruise itineraries and for passenger’s air transportation.
Royal Caribbean also derives revenue by selling goods and services onboard that aren’t included in the ticket price and through sales of vacation insurance protection, tour packages, Pullmantur’s travel agency network services, land-based tours, and air charter businesses to third parties. It also earns revenue from third-party concessionaires who pay a percentage of their revenue to allow RCL to sell their goods and services onboard. You’ll find more on Pullmantur and other brands in Part 4 of this series.
Passenger ticket revenue comprised 72% of the company’s revenue in fiscal 2013. Royal Caribbean’s (RCL) share of revenue from passenger tickets is slightly lower than Carnival Corporation’s (CCL) 75%. Norwegian (NCLH) derived 71% of its revenue from passenger tickets.
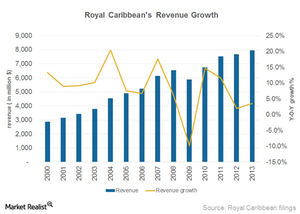
Although Royal Caribbean’s revenue growth is positive, its rate of growth has reduced to 2% and 3.5% in 2012 and 2013, respectively, compared to the double-digit growth in the previous two years. You can invest in shares of cruise liners through the PowerShares Dynamic Leisure and Entertainment Portfolio (or PEJ), the PowerShares Dynamic Large Cap Growth Portfolio (PWB), and the Consumer Discretionary Select Sector SPDR Fund (XLY).
Geographic presence
Royal Caribbean derives more than half of its revenue from the US (52%). It’s been increasingly focusing on the Asian market, especially China. While North American is the largest market for cruises, Asia is a fast-growing market.
More than half the cruise industry’s guests are sourced from North America, and the four-year compound annual growth rate or CAGR of cruise guests sourced from this region was 3.2%. Europe is the next biggest market, with a 30% share and the higher CAGR of 6%. Although Asia-Pacific is a smaller market for cruising, it has high growth potential. The market has grown at an annual rate of 15% between 2011 and 2013.
