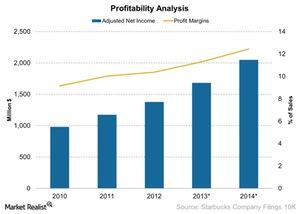
Starbucks’ Net Profit Margins Improve Over 5 Years
SBUX’s net income and net profit margins have been on an uptrend since 2010. At the end of fiscal year 2014, SBUX’s adjusted net income was $2.05 billion.
Dec. 31 2014, Updated 12:39 p.m. ET

Net income
In the last part of this series, we looked at Starbucks’ (SBUX) operating costs and margins. Now, we’ll look at the company’s net income.
In the above chart, we can see that SBUX’s net income and net profit margins have been on an uptrend since 2010. At the end of fiscal year 2014, SBUX’s adjusted net income was $2.05 billion—compared to $1.7 billion in 2013. The net profit margin also increased to 12.4% in 2014—from 11.2% in 2013.
Keep in mind that this is the adjusted net income. It doesn’t include the one-time litigation charge. The charge was related to the settlement with Kraft Foods. We discussed this in the last part of this series.
Dunkin’ Brands (DNKN) had a net profit margin of 20.5%. McDonald’s (MCD) had a net profit margin of 19.8%. Tim Hortons (THI) had a net profit margin of 13%.
Some of the restaurants mentioned above are also included in the SPDR S&P 500 ETF (SPY).
Interest and tax expense
Interest expense increased to $64 million in 2014—from $28 million in 2013. This was a result of an increase in long-term debts to $2.04 billion in 2014—from $1.3 billion in 2013. This debt will be used to expand stores. It will also be used for other expenses.
In 2008, SBUX started reducing its capital expenditure due to a slowdown in the US economy. As the economy gets better, the company is starting to expand. As a result, more capital is required.
In 2014, SBUX’s effective tax rate was 34%.
So, how has SBUX stock performed over a five-year period—compared to its peers? We’ll answer this question in the next part of this series.
