Under Armour’s Cost Profile And Outlook
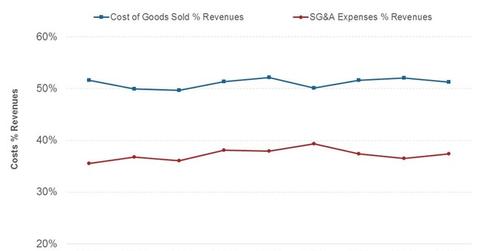
Under Armour, Inc.’s cost of goods sold margins have been fairly steady over the years. SG&A costs are likely to trend higher in the near to medium term.
Dec. 16 2014, Updated 12:00 p.m. ET

Cost of goods sold
Under Armour, Inc.’s (UA) cost of goods sold (or COGS) margins have been fairly steady over the years. Cost of goods sold include manufacturing costs, transportation costs, and royalties paid to celebrities as a percentage of sales, among others. The company’s gross profit margin,[1. Revenues less COGS as a percentage of revenues] came in at 48.7% in 2013.
Selling, general, and administrative (or SG&A) expenses
These include marketing and promotional expense, product innovation and development, outbound handling costs, corporate overheads, and personnel costs, among others. SG&A expenses came in at 37.4% of revenues in 2013.
Future cost-side headwinds and tailwinds
Under Armour, or UA, is projecting an annual decline of 1% in its gross profit margin in 4Q14, down to ~50.3%. This is partly due to the appreciation in the US dollar and higher sales to distributors, which typically earn less.
That said, these headwinds may actually have a lesser impact. A large proportion of costs relate to fabrics used in manufacturing apparel. These are made primarily of synthetic fibers that require petroleum. The current trend in lower oil prices is likely to benefit gross profit margins for the firm in the near term. The COGS should also be lower on lower transportation costs.
A shift towards direct-to-customer sales is also likely to positively impact overall gross margins going forward.
SG&A costs are likely to trend higher, though, in the near to medium term. An ambitious store rollout program—100 stores in international markets in 2015—combined with promotional expenses as the brand launches in more countries, will likely put pressure on SG&A. The company is also likely to aggressively pursue endorsement deals and incur higher costs for developing new products.
