A Technical Analysis of Mining Shares as of October 27
On October 26, 2017, Royal Gold, Newmont, Sibanye, and Yamana had call implied volatilities of 24.8%, 25.9%, 63%, and 48.4%, respectively.
Oct. 31 2017, Published 10:18 a.m. ET

Technical analysis
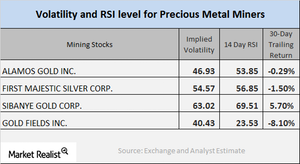
Below, we’ll analyze the directional movement of precious metal mining companies and their technical analysis of a few key indicators, starting with a look at the call implied volatilities and RSI (relative strength index) levels of Royal Gold (RGLD), Newmont Mining (NEM), Sibanye Gold (SBGL), and Yamana Gold (AUY).
Call implied volatility
Call implied volatility is used to read the changes in the price of a stock with respect to the fluctuations in the price of its call option. On October 26, 2017, Royal Gold, Newmont, Sibanye, and Yamana had call implied volatilities of 24.8%, 25.9%, 63%, and 48.4%, respectively.
Generally, mining stocks can often be are known to be more volatile than their precious metals.
RSI reading
RSI levels are used to analyze whether a stock has been overbought or oversold. If a stock’s RSI is higher than 70, it may be overbought, and its price may fall. If a stock’s RSI is below 30, it could be oversold, and its price might rise.
Royal Gold, Newmont, Sibanye, and Yamana now have RSI levels of 20.6, 22.9, 67.6, and 39.3, respectively. The recent decline in these stock prices has led to a considerable fall in their RSI levels.
Notably, the Vaneck Merk Gold Trust (OUNZ) and the PowerShares DB Gold Shares (DGL) have fallen 1.6% and 1.7%, respectively, on a five-day-trailing basis due to the slump in precious metal prices.
