What Halliburton’s Margin Has to Do with Upstream Operators’ Capex
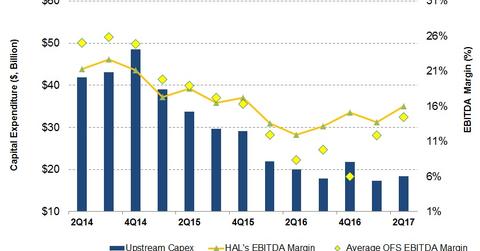
From 2Q16 to 2Q17, Halliburton’s (HAL) EBITDA margin (or EBITDA as a percentage of revenues) rose from 12% to 16%.
Sept. 7 2017, Updated 9:08 a.m. ET

Halliburton’s EBITDA margin
From 2Q16 to 2Q17, Halliburton’s (HAL) EBITDA (earnings before interest, tax, depreciation, and amortization) margin (or EBITDA as a percentage of revenues) rose from 12% to 16%. Essentially, the EBITDA margin is a measure of a company’s operating earnings.
Halliburton makes up 0.14% of the iShares Dow Jones US ETF (IYY). From June 30, 2016, to June 30, 2017, IYY rose 16%, compared with the ~6% fall in HAL’s stock price during the same period.
Upstream operators’ capex cuts
From 2Q16 to 2Q17, 19 of the largest US upstream companies reduced their capital expenditures or capex by 8%. HAL’s EBITDA margin, however, has improved steadily over the past two quarters.
Lower upstream capex typically results in lower prices for OFS (oilfield services and equipment) companies, which reduces their operating revenues and margins, and so Halliburton has done well at beating the trend.
By comparison, Basic Energy Services’ (BAS) EBITDA margin was 5.1% in 2Q17, while Schlumberger’s (SLB) EBITDA was 22.8%, and Patterson-UTI Energy’s (PTEN) EBITDA margin was 22.5%.
Rig count and HAL’s revenues
In 2Q17, Halliburton’s (HAL) revenue share from North America increased to 56%, compared with 52% in 1Q17. In 2Q17, Halliburton generated 44% of its revenues from international operations.
As of September 1, 2017, the US rig count was 943, which is marginally higher than what we saw on June 30, 2017. The international rig count remained nearly unchanged in July 2017 over the previous month. Remember, moderation in the rig count can slow down HAL’s revenues and earnings growth in 3Q17.
In the next part, we’ll discuss Halliburton’s net debt.
