Could American Airlines’ Unit Revenues Decline in 2H17?
TK
Sept. 15 2017, Updated 10:41 a.m. ET

Load factor
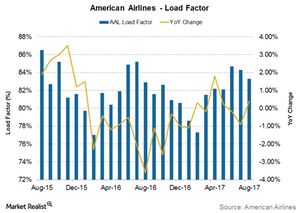
As we discussed earlier in this series, American Airlines’ (AAL) traffic growth has almost matched its capacity year-to-date August 2017. As a result, its utilization remained flat for the period at 81.9%. However, its monthly trend has been volatile. For August 2017, its load factor improved 0.4% to 83.3%.
The load factor is the most commonly used measure of an airline’s capacity utilization and is calculated by multiplying the capacity and traffic. A higher load factor indicates better utilization of aircraft capacity.
Improving yields
Declining fuel costs and improving operational efficiency have helped the airline improve its yields. For 1Q17, American Airlines’ yields increased 2.4% YoY to 16 cents. As a result, unit revenues also improved 3.1% YoY in 1Q16. For 2Q17, its yields rose 4.3% YoY to 16.1 cents, followed by a 5.7% YoY increase in unit revenues to 15.5 cents.
Domestic yields (revenue per seat) recorded growth of 6.4% YoY to 17.7 cents. International yields also grew, albeit at a slower pace of 1.3% YoY to 13 cents.
Outlook
AAL expects the above-discussed factors to continue to adversely impact unit revenues. AAL has projected passenger revenue per available seat mile to record growth of 0.5%–2.5% in 3Q17.
This is better than its peer United Continental (UAL), which expects its yield to fall 3.0%–5.0%. However, it is lower than the guidance given by Delta Air Lines (DAL), which expects its unit revenues to grow 2.5%–4.5% in 3Q17. Alaska Air Group (ALK) does not give any future unit revenue guidance.
Investors can gain exposure to AAL by investing in the PowerShares Dynamic Large Cap Value Portfolio ETF (PWV), which invests 1.6% of its portfolio in AAL.
