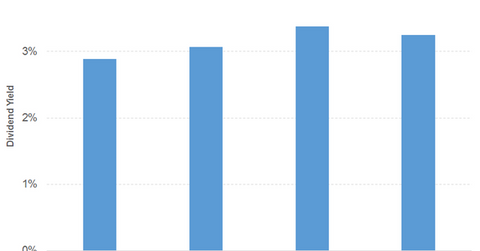
A Look at Coca-Cola’s Dividend Yield
Coca-Cola (KO) recorded a fall of 6.0% in its 2016 net operating revenues due to a decline in its Third Party and Intersegment segments.
Aug. 16 2017, Published 9:46 a.m. ET

Coca-Cola: Consumer goods sector, soft drink beverages industry
Coca-Cola (KO) recorded a fall of 6.0% in its 2016 net operating revenues due to a decline in its Third Party and Intersegment segments in the EMEA (Europe, the Middle East, and Africa), Latin America, and Bottling Investments. Growth was only recorded by the Third Party segment in North America and Asia Pacific. Operating income recorded a lower fall due to lower operating expenses. EPS (earnings per share) fell sharply due to a decline in non-operating losses. The company generates enough free cash flow to pay off its dividends. It also participates in share repurchases. Its financial leverage has increased over the years. So has its debt-to-equity ratio, which has remained at a reasonable level.
Coca-Cola has successfully sustained a dividend yield of more than 3.0%, as you can see in the graph below. (Note that the asterisk in the graph denotes an approximation in calculating the dividend.)
The top line
The company expects its top line to be affected 18.0%–19.0% by its acquisitions and divestitures as well as currency fluctuations in 2017.
Its net operating revenues fell 14.0% in the first half of 2017 by its Asia Pacific and Bottling Investments segments. The Third Party segment recorded growth in the EMEA, Latin America, and North America. Operating income fell, driven by a decline in its top line and other operating charges. All of these factors, followed by higher interest expenses and other losses, led to a sharp fall in EPS. (Note that the asterisk in the graph below denotes the price gain or loss to date.)
Coca-Cola stock has beaten the S&P 500 in 2017 in spite of its earnings results. The company’s core business results have taken a downturn in the face of growing health consciousness among young consumers.
KO stock has risen 9.1% on a YTD (year-to-date) basis. Its peer PepsiCo (PEP) is ahead of Coca-Cola and the S&P 500.
Coca-Cola’s PE (price-to-earnings) ratio of 30.5x compares to a sector average of 36.4x. The company’s dividend yield of 3.2% compares to a sector average of 2.1%.
The First Trust Morningstar Dividend Leaders ETF (FDL) has a dividend yield of 3.2% at a PE ratio of 19.9x. It has the highest exposure to consumer goods. The PowerShares High Yield Equity Dividend Achievers ETF (PEY) has a dividend yield of 2.8% at a PE ratio of 18.6x. It has the highest exposure to utilities.
