What Falling Miner RSI Levels Suggest
The RSI levels of our four select mining giants have all increased lately due to their higher stock prices.
Nov. 20 2020, Updated 3:30 p.m. ET

Mining stock technicals
There are a few technical indicators we have to consider when analyzing the performance of mining stocks. The direction that these technical numbers follow can be useful in determining potential price changes in an asset.
While there are many important indicators that an analyst can monitor, we’ll focus on 14-day RSI (relative strength index) scores and implied volatility.
Among the precious metal mining funds, the Direxion Daily Junior Bull Gold 3X (JNUG) and the Proshares Ultra Silver (AGQ)—both leveraged mining funds—have fallen 21.5% and 10.6%, respectively, on a 30-day trailing basis. Most of the time, the volatility of mining funds is often higher than that of metal-based funds.
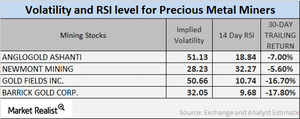
As shown in the chart above, mining stocks have seen significant trailing-30-day declines in prices due to the fall in precious metal prices, and so most mining companies are facing losses over the past month.
Implied volatility
Call implied volatility takes into account the changes in an asset’s price due to variations in the price of its call option. During times of global and economic turbulence, volatility typically rises.
On May 4, 2017, the implied volatilities of Anglo Gold Ashanti (AU), Newmont Mining (NEM), Gold Fields (GFI), and Barrick Gold (ABX) stood at 51.1%, 28.2%, 50.7%, and 92.1%, respectively. Notably, mining companies’ volatilities are often higher than precious metals’ volatilities.
RSI scores
A 14-day RSI score above 70 suggests that a stock price may fall, whereas a score below 30 suggests that a stock price may rise. The RSI levels of the four mining giants mentioned above have all increased due to their higher stock prices.
AngloGold, Newmont, Gold Fields, and Barrick have RSI scores of 18.8, 32.3, 10.7, 9.7, respectively. Notably, these RSI scores have fallen along with the respective companies’ stock prices. Such terribly low RSI levels suggest a pullback in prices soon.
For ongoing updates on this industry, keep checking in with Market Realist’s Metals and Mining page.
