Why High Yield Bonds Are an Effective Match with Equities
AB Keeping Pace with Equity Returns over Time In fact, when we widen the lens to take in the last three decades, high-yield bonds have nearly matched equity performance. And they’ve done it with much lower volatility. Since July 1983, stocks have produced an annualized return of 10.9% (Display 1). High-yield bonds have nearly equaled […]
April 10 2017, Published 1:06 p.m. ET

AB
Keeping Pace with Equity Returns over Time
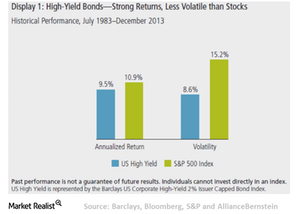
In fact, when we widen the lens to take in the last three decades, high-yield bonds have nearly matched equity performance. And they’ve done it with much lower volatility.
Since July 1983, stocks have produced an annualized return of 10.9% (Display 1). High-yield bonds have nearly equaled that performance, with a 9.5% return over a period spanning two full market cycles as well as countless rallies and sell-offs.
The two asset classes can’t be compared over a longer time frame because earlier high-yield index returns don’t exist. But the 10.9% annualized return for stocks is roughly on par with performance dating back to 1927, so these performance patterns appear to be fairly consistent over time.
High-yield bonds haven’t always kept up with stocks—they’ve been outpaced handily over certain time frames (Display 2), such as when the technology/media/telecom bubble was inflating in the second half of the 1990s. But over the long haul, high yield has produced equity-like returns—with about half the risk of stocks, as measured by the standard deviation of returns.
In fact high yield’s volatility has been consistently lower than that of stocks (Display 3), even though some tumultuous periods for capital markets. These attributes, combined with relatively low correlations to stocks—and very low correlations to other bonds—have made high-yield bonds effective within a diversified portfolio.
Market Realist
High yield bonds have outperformed other fixed income classes
In the previous section, we discussed how high yield bonds (HYG) offer more long-term total return potential than investment-grade and Treasury bonds. According to Bank of America Merrill Lynch, high yield bonds represented by the BofA Merrill Lynch US Cash Pay High Yield Index outperformed investment grade bonds represented by the BofA Merrill Lynch US Corporate Index by 1.4% between January 1993 and September 2016. The BofA Merrill Lynch US Cash Pay High Yield Index provided an average annual return of 8.2%, compared with 6.7% for the BofA Merrill Lynch US Corporate Index.
Strong performance
High yield bonds (JNK), which often behave differently under different economic scenarios, have outperformed other fixed-income categories in most cases. According to J.P. Morgan High Yield Monitor, between 1980 and 2016, high yield bonds recorded negative returns in only five years. On the other hand, S&P 500 (SPY) and ten-year Treasury bonds experienced negative returns in six of the years. Since the global financial crisis, high yield bonds (SJNK) have recorded strong performance and delivered an average annual return of 8.5%.
High yield bonds’ returns compared with stocks’
Bank of America Merrill Lynch research shows that high yield bonds (HYS) returned 8.2% between 1993 and 2016, compared with an 8.4% return by large-cap stocks and a 9.5% return by small-cap stocks. Another study showed that between 1998 and 2015, the Barclays US High Yield Index returned 7.3%, compared with a 7.5% return by the S&P 500. Though high yield bonds have returned less than stocks, they help lower the volatility of a portfolio.
