How Did Ford Motor’s Sales in China Turn Out in October 2016?
Price movement Ford Motor (F) has a market cap of $46.2 billion. It rose 2.1% to close at $11.58 per share on November 7, 2016. The stock’s weekly, monthly, and year-to-date (or YTD) price movements were -1.4%, -4.6%, and -12.1%, respectively, on the same day. Ford is trading 1.4% below its 20-day moving average, 3.4% […]
Nov. 20 2020, Updated 2:57 p.m. ET

Price movement
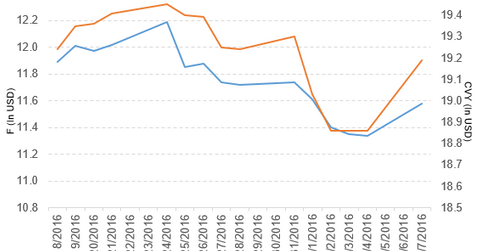
Ford Motor (F) has a market cap of $46.2 billion. It rose 2.1% to close at $11.58 per share on November 7, 2016. The stock’s weekly, monthly, and year-to-date (or YTD) price movements were -1.4%, -4.6%, and -12.1%, respectively, on the same day. Ford is trading 1.4% below its 20-day moving average, 3.4% below its 50-day moving average, and 6.8% below its 200-day moving average.
Related ETF and peers
The Guggenheim Multi-Asset Income ETF (CVY) invests 0.88% of its holdings in Ford Motor. The ETF tracks the Zacks Multi-Asset Income Index. The index aims to outperform the Dow Jones US Select Dividend Index, using US stocks, ADRs (American depositary receipts), REITs, MLPs, CEFs (closed-end funds), preferred stocks, and royalty trusts. The YTD price movement of CVY was 9.4% on November 7. The market caps of Ford Motor’s competitors are as follows:
Sales of Ford Motor in October 2016
Ford Motor reported total vehicles sales of 188,813 units, a fall of 11.7% from October 2015.
Sales by brand
- Ford brand reported sales of 179,744 units, a fall of 12.5% from October 2015. Focus car, Explorer SUV (sports utility vehicle), Escape SUV, Fusion car, and Transit Connect truck sales fell 43.0%, 14.1%, 4.9%, 21.0%, and 61.5%, respectively, and Transit truck sales rose 9.0%.
- Lincoln brand reported sales of 9,069 units, a rise of 6.9% over October 2015. MKS car and MKC SUV sales fell 29.0% and 3.3%, respectively, and MKX SUV and MKZ car sales rose 4.1% and 3.1%.
Sales by type
- Cars reported sales of 44,925 units, a fall of 27.5% from October 2015.
- SUVs reported sales of 60,166 units, a fall of 9.4% from October 2015.
- Trucks reported sales of 83,722 units, a fall of 2.2% from October 2015.
Sales in China
Ford and its joint ventures reported sales of 107,618 units, a rise of 14.0% from October 2015.
- Changan Ford Automobile (CAF) reported sales of 82,368 units, a rise of 10% from October 2015. CAF reported sales of 745,650 units year-to-date, a rise of 14.0% YoY (year-over-year).
- Jiangling Motor (JMC) reported sales of 23,949 units, a rise of 29% from October 2015. JMC reported sales of 206,578 units YTD, a rise of 3% YoY.
- Imported Ford vehicles reported sales of 1,301 units, a rise of 0.46% YoY.
Next, we’ll discuss Snyder’s-Lance (LNCE).
