Will Gold Rally if Volatility Picks Up?
It’s true that market volatility has been unusually low lately, but it’s expected to rise. There are several ways to mitigate the impact of rising volatility and historically, gold has been one of the more effective tools.
Dec. 2 2019, Updated 9:47 a.m. ET
When volatility is on the rise
It’s true that market volatility has been unusually low lately, but it is expected to rise. There are several ways to mitigate the impact of rising volatility and historically, gold has been one of the more effective tools. Looking at monthly Bloomberg data from 1994 to the present, changes in the VIX Index, a measure of US equity volatility, explain nearly 20% of the variation in the relative return between gold and the S&P 500 Index.
In months when volatility rose, gold outperformed the S&P 500 price return by roughly 2% on average. It is worth highlighting the reliability of the relationship: In months when the VIX was higher, gold outperformed 62% of the time. In contrast, when the VIX fell, gold beat the S&P 500 only 35% of the time.
Interestingly, gold’s value as a hedge has historically been most pronounced during those periods when you need it the most. Put differently, historically gold has outperformed equities by an even larger magnitude when volatility is rising from an already elevated level. Again, from 1994 to the present using Bloomberg data, during months when the VIX was already above 20 and rose even further, gold outperformed by an average of nearly 5%, beating the S&P 500 roughly 75% of the time.
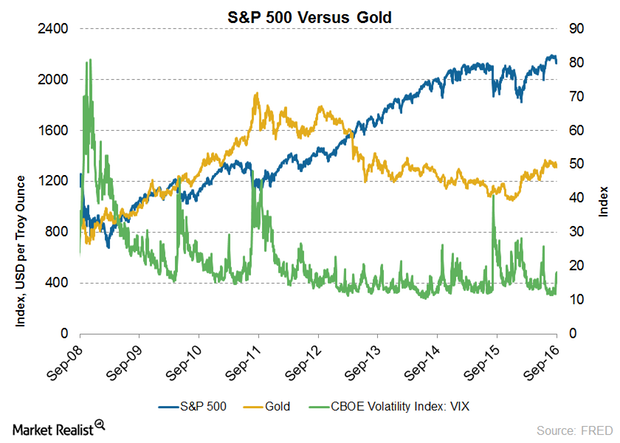
Market Realist – The period of gold rally
Russ Koesterich has aptly put forward his reason for not abandoning gold. Not only has gold outperformed historically when volatility is on the rise, but it also pays to add to gold positions as volatility increases. Therefore, we will try to break down the periods of high and low volatilities and compare the performance of gold. Lastly, we will compare dollar prices with gold and Treasury bond yields with gold.
How did 2008–2009 shape up for gold?
The producer price index (or PPI) for gold recorded a growth of 101.1% between 2008–2012. The PPI grew 2.6% and 12.8% during 2008 and 2009, respectively. During the recessionary period, the quantitative easing by the US Federal Reserve led to depreciation in the value of the dollar. As a result, investors flocked to gold to protect their assets, and the value of gold appreciated.
The S&P 500 ended 2008 with a year-to-date (or YTD) decline of almost 38% while the NASDAQ lost ~40%. The index slowly started recovering from the second half of 2009 and ended with YTD growth of ~20%.
Oil prices dipped from the plus-$100 mark to $41.60 on December 1, 2008. Oil prices increased to $74.70 on December 1, 2009.
Gold from 2010–2011
Gold prices shot up by ~51% between September 2010 and September 2011 due to the high volatility in the market and concerns over a recovery. Gold prices breached the $1,900 mark by the end of August 2011. In 2008 and 2009, the average gold price was $872 and $972, respectively. Gold breached the $1,000 mark in October 2009.
The first half of 2010 brought mixed results from the S&P 500, and growth slowly picked up in October 2010. The year ended with a YTD growth of 11%. However, growth started dipping again in August 2011 after posting growth in the first half. The year ended with a YTD decline of 1.1%.
The $100 mark was again breached by oil prices in February 2011 to drop again in September 2014 beginning.
The SPDR Gold Trust ETF (GLD) generated a return of 3% in 2008. The iShares COMEX Gold Trust ETF (IAU) and the PowerShares DB Gold ETF (DGL) generated returns of 5.4% and 2.8%, respectively, in 2008. The PowerShares Dynamic Banking ETF (PJB) and the iShares NASDAQ Biotechnology ETF (IBB) took hits of 12.6% and 12.7%, respectively, in 2008.
The Vanguard Extended Duration Treasury Index ETF (EDV) and the iShares 20+ Year Treasury Bond ETF (TLT) generated returns of 55.5% and 33.8%, respectively, in 2008. The CurrencyShares Japanese Yen ETF (FXY) and the iPath JPY/USD Exchange Rate ETN (JYN) generated returns of 23% each in 2008.
A rather tepid 2012
In 2012, gold recorded a growth rate of 5.4% even though it was hammered by the weak dollar, lower interest rates, a debt crisis, and quantitative easing by the Federal Reserve. The average gold price remained at almost $1,700.
In the meantime, the S&P 500 was back in action as volatility started cooling down. The index recorded a growth of ~12% YTD on December 31, 2012, as growth started picking up from the beginning of the year.
The iShares Gold Trust ETF (IAU) and the ETF Securities Swiss Gold Trust (SGOL) both grew over 6% in 2012.