How Ford Motor Performed in July 2016
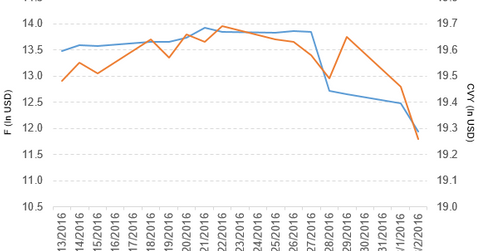
Ford Motor (F) has a market cap of $47.6 billion. It fell by 4.3% to close at $11.94 per share on August 2, 2016.
Aug. 5 2016, Updated 9:05 a.m. ET

Price movement
Ford Motor (F) has a market cap of $47.6 billion. It fell by 4.3% to close at $11.94 per share on August 2, 2016. The stock’s weekly, monthly, and year-to-date (or YTD) price movements were -13.9%, -5.1%, and -10.5%, respectively, on the same day.
Ford is trading 9.6% below its 20-day moving average, 8.5% below its 50-day moving average, and 7.8% below its 200-day moving average.
Related ETF and peers
The Guggenheim Multi-Asset Income ETF (CVY) invests 0.95% of its holdings in Ford Motor. The ETF tracks the Zacks Multi-Asset Income Index. The index aims to outperform the Dow Jones US Select Dividend Index using US stocks, ADRs, REITs, MLPs, CEFs, preferred stocks, and royalty trusts. The YTD price movement of CVY was 7.2% on August 2.
The market caps of Ford Motor’s competitors are as follows:
Sales of Ford Motor in July 2016
Ford Motor reported total vehicle sales of 216,479 units, a fall of 2.8% from July 2015.
Sales by brand
- Ford brand reported sales of 207,381 units, a fall of 2.7% from July 2015. Its Focus car, Explorer SUV, Escape SUV, and Taurus car sales fell by 17.9%, 22.2%, 10.2%, and 44.3%, respectively,
- Lincoln brand reported sales of 9,098 units, a fall of 4.6% from July 2015.
Sales by type
- Cars reported sales of 59,854 units, a fall of 9.3% from July 2015.
- SUVs reported sales of 69,521 units, a fall of 5.6% from July 2015.
- Trucks reported sales of 87,104 units, a rise of 4.8% from July 2015.
Now we’ll discuss Fiat Chrysler Automobiles.
