Why Your Portfolio Needs More Carry
Since 2009, equities have staged a comeback. Between 2010 and 2015, the S&P 500 index has risen 10.3% on a CAGR basis. Most of the comeback is due to multiple expansion.
June 1 2016, Published 5:11 p.m. ET

The prospect of lower stock returns and higher volatility going forward suggests for Russ that investors should consider strategies such as carry, or yield, to boost risk-adjusted returns.
Twenty years ago investing was much easier. Between 1995 and 1999 the S&P 500 staged a remarkable streak of five straight years in which total return exceeded 20 percent. But that period was followed by a prolonged period of subpar returns.
Is history repeating itself? Few would confuse the last seven years with the late 1990s, but equities, particularly U.S. stocks, have once again been producing outsized returns. Even including 2015’s flat performance, between 2009 and 2015 the average price return on the S&P 500 was nearly 13 percent. This is unlikely to hold over the next seven years.
But if price appreciation becomes harder to come by, investors need to consider the role of positive cash flow, whether through dividends, or yields. This is referred to as “carry” by financial professionals.
Market Realist – Your portfolio needs more carry.
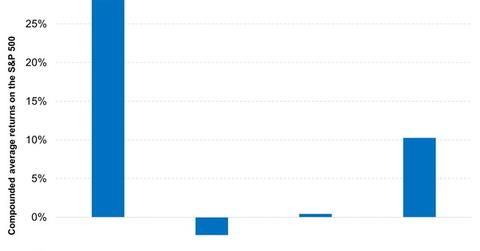
The above graph compares how the S&P 500 index (SPY) (IVV) has performed over the last two decades. Between 1995 and 1999, the S&P 500 rose by a staggering 28.2% on a CAGR (compounded annual growth rate) basis, including dividends.
However, the next two five-year periods saw flattish returns. The index fell by 2.3% on a CAGR basis and was more or less flat from 2005–2009. These two periods saw two massive busts, including the IT (information technology) bubble burst in the early 2000s and the financial (XLF) crisis of 2008.
However, since 2009, equities (IWM) (OEF) have staged a comeback. Between 2010 and 2015, the index has risen by 10.3% on a CAGR basis, including dividends. However, most of this comeback is due to multiple expansion. Corporate earnings have been declining since late 2014.
Between 1995 and 1999, GDP averaged around 4%. However, it has averaged 1.8% since 2001, which is one of the reasons that returns have been shrinking. Also, current valuations are high relative to historic levels. All these point to lower stock returns in the next few years. We’re already seeing this in play. Since the start of 2015, the index has risen by a paltry 1.5%.
