Why Are Analysts So Positive about General Mills?
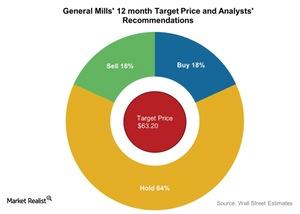
About 64% of analysts rate General Mills a “hold,” 18% rate it a “sell,” and 18% rate it a “buy.”
July 12 2016, Updated 5:08 p.m. ET

Target price
As of June 29, 2016, General Mills (GIS) was trading at $67.86. Let’s see what Wall Street analysts are recommending for General Mills after its 4Q16 earnings release.
About 64% of analysts rate General Mills a “hold,” 18% rate it a “sell,” and 18% rate it a “buy.”
Consensus rating for General Mills
The average broker target price for General Mills has increased to $63.20 from $61.21. The current trading price as of June 29, 2016, is 7% higher than the stock’s target price.
To gain exposure to General Mills, you can invest in ETFs such as the Victory CEMP US EQ Incom Enhanced Volatility Wtd Index ETF (CDC) and the PowerShares High Yield Equity Dividend Achievers ETF (PEY), which invest 1.5% and 1.6%, respectively, in General Mills.
The company’s peers have target prices and return potentials as follows:
Recommendations for General Mills
RBC Capital Markets and Stifel have given General Mills the highest target prices of $73 and $72, respectively. Both firms rated the stock a “strong buy.” RBC Capital Markets increased its target price to $73 from $70 after the earnings results.
On June 23, 2016, Deutsche Bank raised its price target on the stock to $63 from $62 and gave it a “hold” rating.
Wells Fargo Securities, Morningstar, and Consumer Edge Research didn’t provide target prices for the stock. Société Générale assigned General Mills the lowest target price of $50, which is 26% lower than the closing price on June 29, 2016.
Valuation multiple
We’ll use the forward PE (price-to-earnings) multiple to compare General Mills’ (GIS) valuation with the valuations of its peers. A forward PE valuation multiple indicates how much an investor is willing to pay for a company’s next four quarters of EPS (earnings per share).
General Mills is trading at a slightly higher forward PE multiple compared to its peers. It’s currently trading at 22.3x for the next 12-month EPS as of June 29, 2016. Kellogg (K) and Pinnacle Foods (PF) are trading at 20.6x and 20.5x, respectively, for the next 12-month EPS.
In the next and final part of our series, we’ll see how General Mills is trading compared to its key moving averages.
