Analyzing Cost Structure for Medical Device Companies
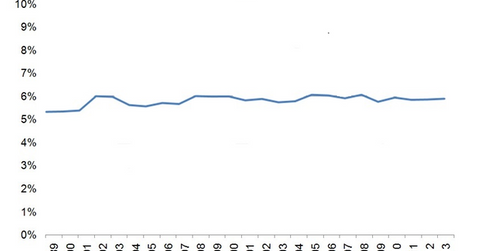
As per the US Census, spending on medical devices in the US has been constant for over a decade between 2005 to 2015.
Dec. 7 2015, Updated 12:04 a.m. ET

Medical device spending
As per the US Census, spending on medical devices in the US has been constant for over a decade between 2005 to 2015. Over the last decade, the consumer price index (or CPI) rose by 2.4% and the medical care consumer price index (or MC-CPI) rose by 3.6%. However, medical device prices have witnessed an average annual rate of increase of only 0.7%. As substantiated by the National Health Expenditure (or NHE), an equivalent rate of increase in medical device spending and the relatively slow rate of price increases highlight the highly competitive nature of the medical device industry along with significant cost pressures.
Operational structure
Consolidation to achieve scale and access new technologies and products usually leads to the emergence of operational inefficiencies in a company, which can be disruptive for cost structure optimization. Thus, restructuring and streamlining the process and capabilities across the supply chain is imperative for a company growing inorganically. Also, inventory streamlining and efficient logistics operations can help improve medical device cost structure for a device manufacturer.
Selling, general, and administrative expenses
Average selling, general and administrative (or SG&A) expenses incurred by medical device manufacturers are approximately 36% of total revenues as per Advamed’s 2015 report. Big players in the low-tech and high volume segment incur significantly higher SG&A costs than high-tech niche players, which incur higher research and development (or R&D) costs. Different strategies and models are being adopted by big players to bring improvement in sales operations along with a reduction in indirect costs as part of SG&A’s cost containment measures. For instance, medical device companies like Wright Medical (WMGI) and Cardinal Health (CAH) have launched rep-less sales models where trained hospital staff replaces the medical device company sales representatives. This has enabled significant SG&A expense reduction by slashing marketing and training costs.
Research and development
Top medical device players spend between 6% and 12% of revenues towards R&D investment. For smaller manufacturers, technology and innovation are differentiating factors. Thus, R&D expenses remain significant cost components that drive the long-term productivity of companies. Big players, however, make smaller investments in R&D and focus on improving margins and productivity through expanding scale and services. Medtronic (MDT) makes significant investments in R&D but saw a decline from 9.4% in 2013 to 8.7% in 2014. However, for a niche firm like Illumina (ILMN), R&D spending rose from 22% to 24% from 2013 to 2014, respectively.
One of the major ETFs with exposure to the US medical device industry is the iShares U.S. Medical Devices ETF (IHI).
