Volatility: Risks and Rewards Go Hand in Hand
The Sharpe ratio is calculated using standard deviation as its volatility measure.
Nov. 20 2020, Updated 5:27 p.m. ET

Volatility measures: risk and reward
Investors want returns based on how much risk they accept in an investment. The higher the risk, better the reward and vice versa. Alpha, beta, R-squared, standard deviation, and the Sharpe ratio are the popular measures of evaluating mutual fund volatility measures. Let’s see how these risk measures have fared in the case of our commodities mutual funds.
Although these measures are based on historical performance of the fund and do not guarantee future returns, they are considered as powerful tools for a comparative analysis of mutual funds and risk evaluation.
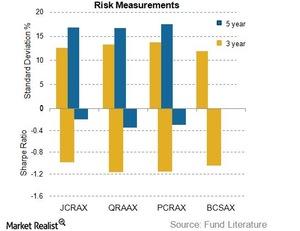
The above figure shows the volatility of the returns for our commodity mutual funds. The BlackRock Commodity Strategies Investor Fund (BCSAX) does not have a five-year component in the chart, as the fund’s inception date was 2012.
Dispersion from the mean: Standard deviation
The standard deviation of a mutual fund is a volatility measure that indicates how much the returns deviate from the fund’s average historical returns. The smaller the dispersion, the smaller the risk. Using these volatility measures, one can infer how consistently the fund has performed in the past.
In the case of the PIMCO Commodity Real Return Strategy ETF (PCRAX), the standard deviation for the three-year period stood at 13.81%, and it was 17.52% for a five-year period. For the Oppenheimer Commodity Strategy Total Return ETF (QRAAX), the standard deviation for the last three years was 13.3%, down from its 17% mark.
Risk-adjusted return: Sharpe ratio
The Sharpe ratio, also known as the reward-to-variability ratio, is an extra return made by a portfolio against each unit of risk. The higher the ratio, the better the fund is. The Sharpe ratio is calculated using standard deviation as its volatility measure. In this case, it is prudent to compare the two funds based on what risks they take to generate excess return.
The ALPS CoreCommodity Management Complete Commodities Strategies ETF (JCRAX) has a Sharpe ratio of -0.98 for a three-year period, indicating underperformance from a five-year horizon. The Sharpe ratio for the BlackRock Commodities Strategies Investor ETF (BCSAX) is -1.04.
Many of the above mutual funds park their funds in commodity-related equities like Chesapeake Energy (CHK), Barrick Gold (ABX), CF Corporation (CF), and Pilgrim’s Pride Corporation (PPC). PPC forms 3.5% in the First Trust Consumer Staples Alpha ETF (FXG).
