Capacity Factors Still Indicate Shift from Coal to Natural Gas
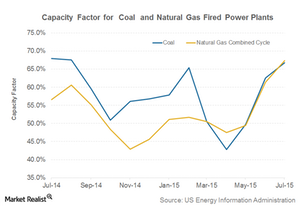
Capacity factors for coal-fired plants fell YoY and rose substantially for natural gas-fired power plants. This shows a shift from coal to natural gas as a fuel for electricity generation.
Oct. 6 2015, Updated 4:06 a.m. ET

The latest EIA report
On September 24, the EIA (U.S. Energy Information Administration) published its latest report on capacity factors for power plants based on data for July 2015. Capacity factors for both coal and natural gas plants rose month-over-month due to higher electricity demand for cooling.
Historically, coal has boasted higher utilization. But in April 2015, natural gas surpassed coal in both utilization rate and market share. In July 2015, the coal-fired power plants’ capacity factor came in marginally lower than the capacity factor for natural gas. This was in line with the fact that natural gas surpassed coal’s market share again during the month, as we saw in part 6 of this series.
The capacity factor for coal-fired power plants came in at 66.7% in July 2015, compared to 62.5% in June 2015. During the same period, the utilization rate of natural gas plants rose to 67.3% from 61.4%. However, the YoY (year-over-year) capacity factor for coal fell, and natural gas-fired power plants saw an uptick in utilization rate during the same period.
Impact on coal
Capacity factors for coal-fired plants fell YoY. By contrast, capacity factors for natural gas-fired power plants rose substantially during the same period.
This development indicates a continued shift from coal to natural gas as a fuel for electricity generation. This kind of shift is negative for thermal coal producers such as Peabody Energy (BTU), Cloud Peak Energy (CLD), Alliance Resource Partners (ARLP), and Arch Coal (ACI).
Capacity factors
Capacity factors are an important indicator when it comes to understanding power plants’ utilization levels. They measure how often a power plant runs in a given period and also the maximum capacity at which a power plant can run.
For example, if a power plant with a capacity of 600 MW (megawatts) operates at a 50% capacity factor on a given day, it generates electricity equivalent to what a 300 MW power plant would produce if it ran at 100%.
The EIA publishes capacity data for various fuel types every month. For various utility companies’ market exposure, check out the Utilities Select Sector SPDR ETF (XLU).
