What are the disadvantages of technical analysis?
Technical analysis is used to forecast stocks. All of the technical indicators give possible entry and exit points. The forecasting accuracy isn’t 100%. This is one of disadvantages of technical analysis.
Nov. 21 2019, Updated 2:39 p.m. ET

Disadvantages of technical analysis
In this part of the series, we’ll discuss the disadvantages of technical analysis. This is useful for trading strategy.
Technical indicators’ mixed signals
In some cases, one of the technical indicators will show a buy signal and another indicator will show a sell signal. This causes confusion in trading decisions. This is one of the disadvantages of technical analysis. So, some traders use a combination of technical indicators, patterns, volume, and moving averages to determine the entry and exit point.
Accuracy
Technical analysis is used to forecast stocks. All of the technical indicators give possible entry and exit points. The forecasting accuracy isn’t 100%. For example, when a possible entry or exit point for a stock is suggested, it doesn’t guarantee a successful trade. Stock may decrease after the entry. Stock can also rise after the exit.
Biased opinion
One technical analyst’s opinion may contradict another analyst’s opinion for the same stock. The technical methods that are used to analyze stocks can vary from one analyst to another.
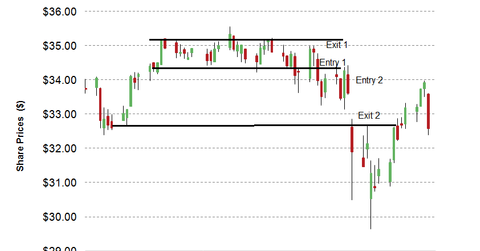
The above chart shows entry and exit points for Intel’s (INTC) stock.
The chart shows two trading strategies. The strategies are by two different technical analysts. The stock is trading in the range. So, an analyst suggested entry 1 and exit 1 points anticipating range-bound stock price movement. Another analyst, anticipating breakdown, suggested entry 2 and exit 2 points. This is one of the disadvantages of technical analysis.
