The Fed taper: How quantitative easing affects the yield curve
QE is an unconventional form of monetary easing—the Fed’s way of putting in more money into circulation in the economy.
Oct. 29 2019, Updated 6:50 p.m. ET
Monetary easing is the Fed’s way of putting in more money into circulation in the economy. Quantitative easing is an unconventional form of monetary easing. In this form, the central bank purchases government securities or other securities from the market in order to lower interest rates and increase the money supply. Quantitative easing (or QE) or the Fed’s mass bond-buying program is considered when short-term interest rates are at or approaching zero, and it does not involve the printing of new banknotes.
As of now, there have been three rounds of QE in the U.S. The first, that is, QE1 was undertaken to provide stimulus to the economy right after the credit crises of 2008. The second round of stimulus or QE2, was initiated in the fourth quarter of 2010 in order to jump-start the sluggish pace of economic recovery in the U.S.
This was followed by a round of operation twist in 2011, whereby the Fed purchased long-term bonds and sold short-term bonds, which helped in extending the average maturity of the Fed’s own portfolio. This was an attempt similar to QE, without printing more money, and also, without expanding the Fed’s balance sheet, and hopefully avoiding the inflationary pressure associated with QE.
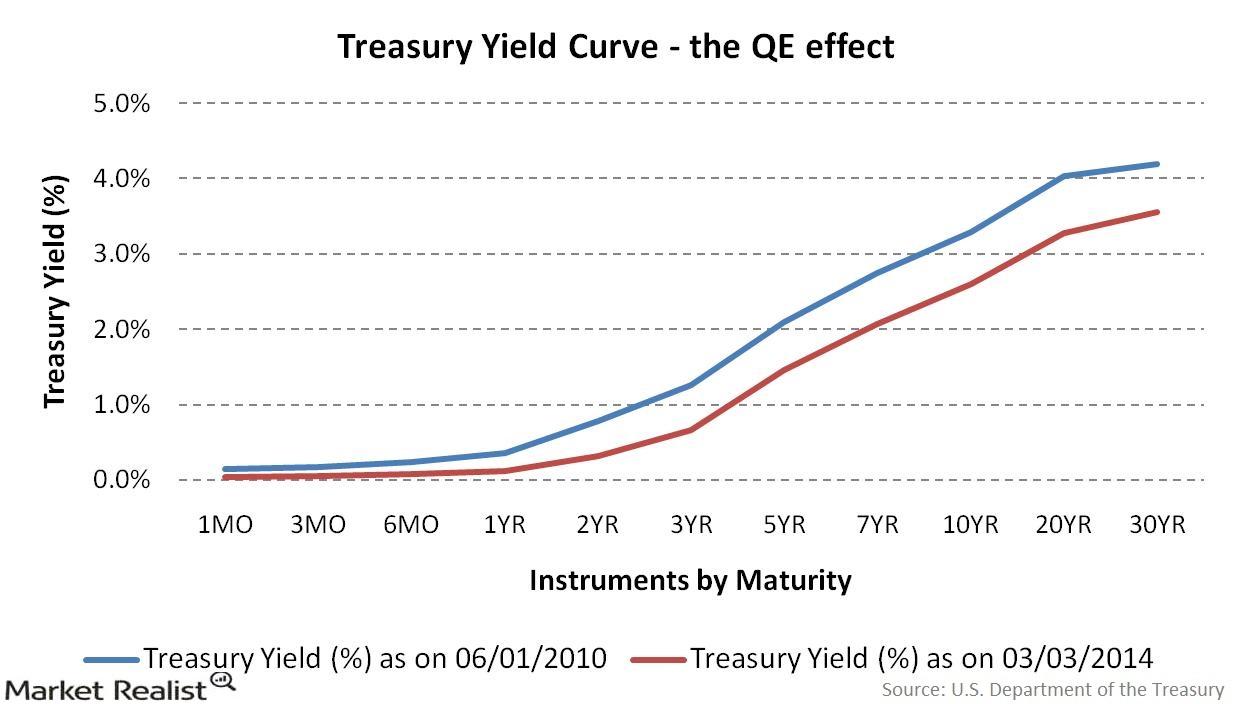
Subsequently, a third round of QE was undertaken by the Fed in the fourth quarter of 2012. As can be seen in the chart above, the Fed’s QE initiatives have successfully shifted the yield curve downward, that is, lowered the Treasury yields across maturities.
Various exchange-traded funds (or ETFs) track the performance of U.S. Treasury securities with varying maturities. For example, the iShares Barclays 1-3 Year Treasury Bond Fund (SHY) and the iShares Barclays 20 Year Treasury Bond Fund (TLT) track the performance of short-term and long-term U.S. Treasury securities, respectively. The returns from these ETFs vary with the returns of the underlying Treasury securities. Accordingly, TLT has a YTD yield of 4.38% vis-à-vis SHY which delivers a YTD yield of 0.08%; sector ETF returns are affected by the performance of the sector. For example, the State Street Energy Select Sector SPDR Fund (XLE), which tracks stocks of the energy sector like Exxon Mobil Corporation (XOM) and Chevron (CVX), has a YTD of -1.53% owing to the poor state of energy sector.