ETFS Physical Silver
Latest ETFS Physical Silver News and Updates
Where Is the Gold-Silver Ratio Headed?
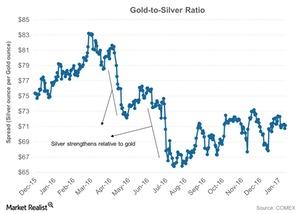
When analyzing the precious metals market, it’s important to take a look at the relationship between gold and silver.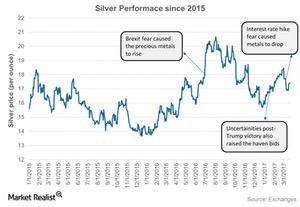
These Factors Have Been Driving Silver Prices
Silver has performed slightly better than gold and platinum on a year-to-date basis.
These Mining Stocks Have Downward Trending Correlations with Gold
Uncertainty in the market significantly affects the performances of precious metals. It also affects precious metals mining stocks, which are known to closely track precious metals.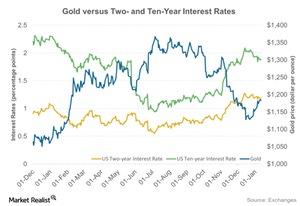
What Scenarios Decide How Precious Metals Move?
The directional move of the interest rate is a crucial determinant of the direction precious metals will take.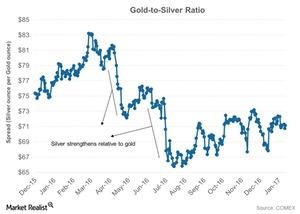
Reading the Ups and Downs of the Gold-Silver Spread
The gold-silver spread was trading at 68.5 on February 23, 2017. The spread suggests that it took 68.5 ounces of silver to buy a single ounce of gold.
Mining Stocks and Gold Prices: Reading the Correlation
It’s important to understand which mining stocks have overperformed and underperformed precious metals.
Analyzing the Correlations of Precious Metals Mining Stocks
Mining companies that have high correlations with gold include B2Gold (BTG), Royal Gold (RGLD), Agnico Eagle Mines (AEM), and Primero Mining (PPP).
Inside Gold’s Upward and Downward Correlation Trends
Precious metal prices have risen due to uncertainty since Donald Trump won the US presidential election.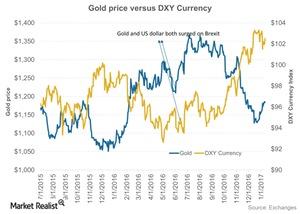
How GDP Numbers Impacted Gold and the Dollar
The reason behind the fall of the dollar on Friday, January 27, 2017, was lower-than-expected GDP numbers. The DXY ended the day 0.10% higher.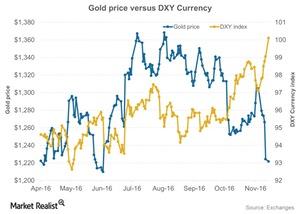
US Dollar Played on Gold in 2016
The correlation between gold and the US Dollar Index is -0.36. It means that about 36.0% of the time, gold and the dollar move in opposite directions.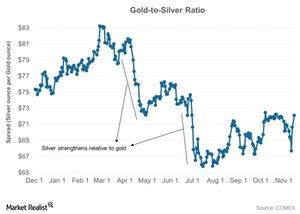
How Has the Gold-Silver Ratio Trended in 2016?
Gold and silver have been strong for the past few days. However, silver has substantially outperformed gold year-to-date.
Reading the RSI Levels and Volatilities of Mining Companies
Many of the fluctuations in precious metals have been determined by the Federal Reserve’s interest rate stance. These variations play on precious metals funds.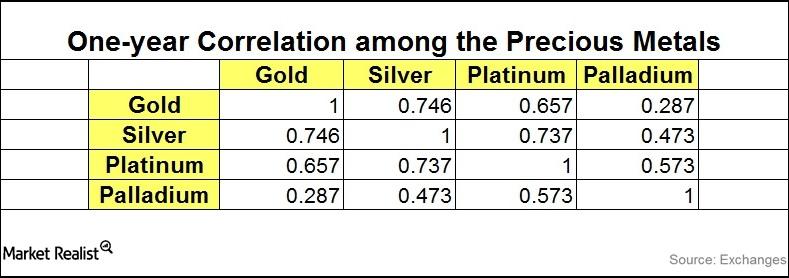
What Does the Precious Metal Correlation Suggest?
Gold and silver have a strong correlation close to 75%. This suggests that about 75% of the time, a fall in gold prices leads to a fall in silver prices.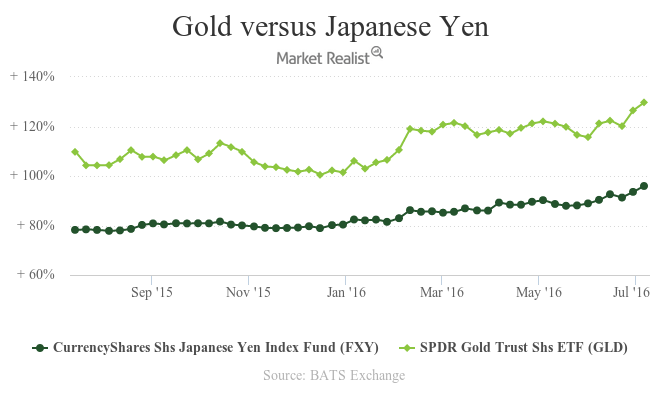
How Did the Japanese Yen Correlate with Gold?
The falling equity market took down the Japanese stock markets too.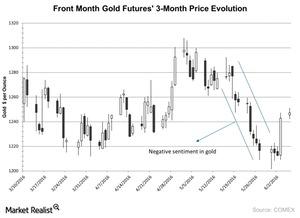
Why Hedge Funds Liquidated Some of Their Gold
Hedge funds increased their bets on gold as prices fell after gold’s gains in 1Q16. However, hedge funds and money managers curbed their bets on gold as it fell steadily in May.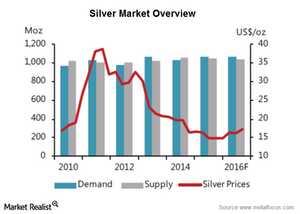
What Is the Silver Supply and Demand Scenario?
In 2016, silver has outperformed its precious metal peers. Silver has risen about 19.6% on a year-to-date basis while gold has risen 18%.
