iShares Russell Top 200 Growth
Latest iShares Russell Top 200 Growth News and Updates
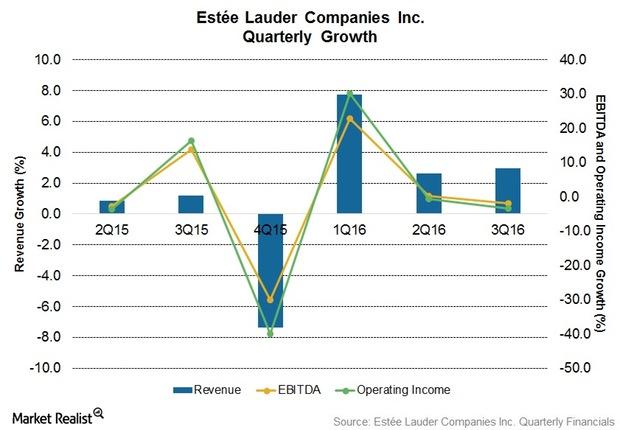
Estée Lauder’s Growth Initiative: Leading Beauty Forward
With increasing competition from L’Oréal, Shiseido, and Coty, Estée Lauder continues to expand its position in Western Europe and emerging markets.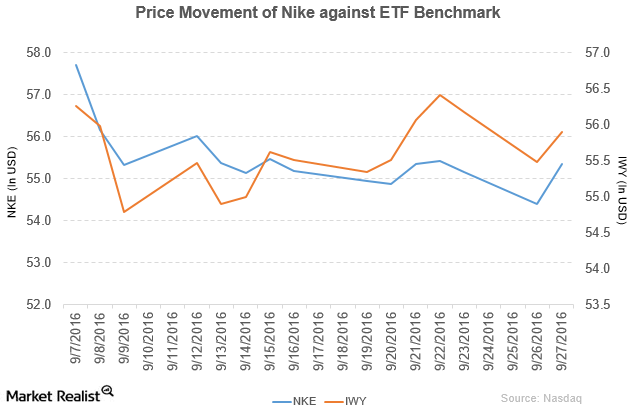
How Did Nike Perform in 1Q17?
Nike (NKE) has a market cap of $92.9 billion. It rose 1.7% to close at $55.34 per share on September 27, 2016.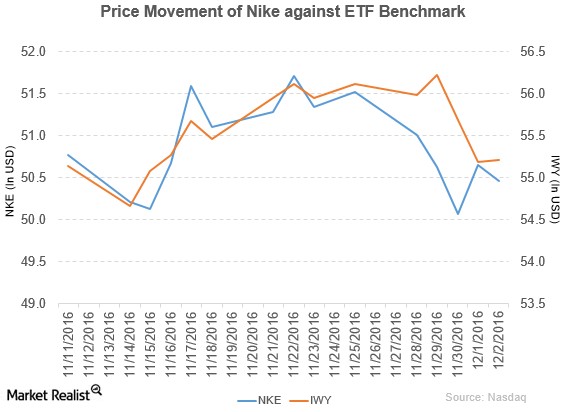
Nike Announces the Launch of New Products
Nike (NKE) fell 1.7% to close at $50.46 per share during the fifth week of November 2016.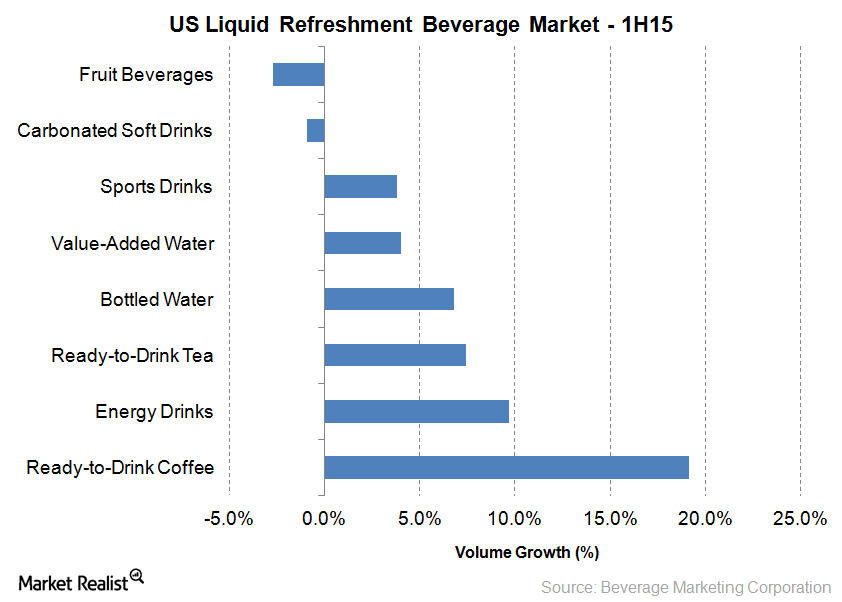
Coca-Cola Is Open to Inorganic Growth in Still Beverages
Coca-Cola has a dominant presence in the sparkling beverages market, but it’s the still beverage space that has huge growth prospects.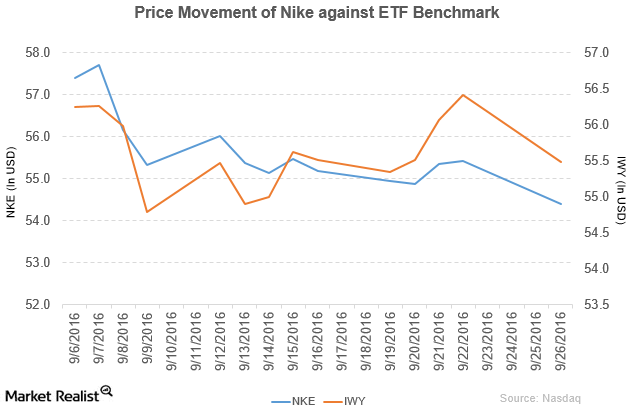
Why Did Nike Stock Fall on September 26?
Nike (NKE) has a market cap of $91.3 billion. It fell 1.4% to close at $54.40 per share on September 26.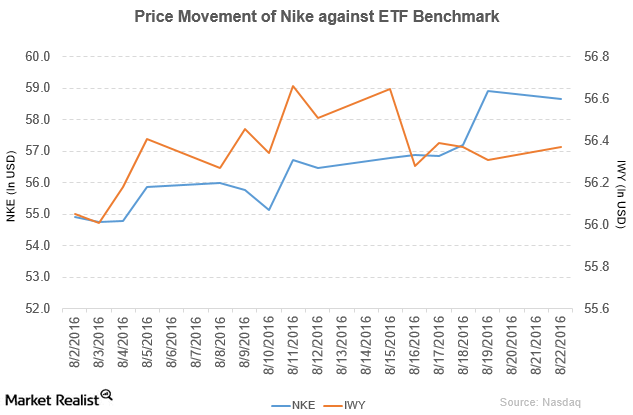
Why Did Nike Update Its Nike+ Run Club App?
In fiscal 2016, Nike reported revenue of $32.4 billion—a rise of 5.9% year-over-year. The company’s gross profit margin rose by 0.43% in fiscal 2016.