How to Read a Bitcoin Rainbow Chart and Maximize Your Profits
Studying a Bitcoin rainbow chart can help you identify the appropriate points to buy or sell the crypto to maximize your profits. Here's how it works.
June 29 2021, Published 1:19 p.m. ET

Investors are turning to crypto trading signals providers to know the best time to buy or sell a cryptocurrency to maximize profits. You can complement those signals with your own cryptocurrency analysis. Knowing how to read a Bitcoin rainbow chart is a great place to start.
Bitcoin is the flagship cryptocurrency and many people getting into crypto investing start with it. Bitcoin has delivered blockbuster returns for early investors and many beginner investors want to find the next Bitcoin. Knowing how to analyze a Bitcoin rainbow chart can be a gateway into finding the next altcoins that could explode.
Bitcoin rainbow chart, explained
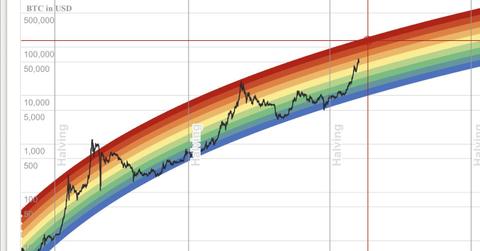
Many crypto investors still aren't familiar with the Bitcoin rainbow chart and they might be missing important information for their trading activities. The Bitcoin rainbow chart is a logarithmic chart that depicts long-term Bitcoin price movements.

The chart is rendered in a colored band that looks like a rainbow shape. The chart attempts to show investors what the best time to buy or sell Bitcoin was in the past and what might be the best time to do so now. It can be an ideal source of trading information for those looking for great entry points for a long-term position.
Bitcoin's price fluctuates all the time. The price plunged after Tesla stopped accepting Bitcoin as a payment and spiked after Cathie Wood filed to set up a Bitcoin ETF. Although the crypto has been up and down many times, its long-term trend has been consistently upward. Working with rainbow charts helps you ignore the daily volatility and focus on long-term prospects.
How to read a Bitcoin rainbow chart
The Bitcoin rainbow chart color bands show when the crypto is oversold and overbought. The lower part of the band shows when Bitcoin is oversold and these are represented by blue and green colors. As you move up the band, the colors change to yellow, orange, and red.
The blue and green color zones show the appropriate moments to buy Bitcoin. Investors wanting to accumulate would do so when the price is in those zones. When the price gets to yellow, orange, and red areas, it would be a signal for investors who want to sell.
However, a study of the Bitcoin rainbow chart also reveals an interesting evolution in the price of the crypto. As time goes by, a price considered expensive currently might turn out to be cheap later. In 2013, Bitcoin's price hit an all-time high of $1,000 and some investors thought it had become too expensive. In 2017, the crypto hit another peak at $20,000 and a price that seemed too expensive five years earlier looked cheap.
Bitcoin price prediction and rainbow chart
Investors have more resources now to assess crypto price prospects to take appropriate actions. For example, in addition to crypto trading signals from Telegram channels and other sources, investors can gauge the best time to buy Bitcoin by assessing analysts’ price predictions and studying the crypto’s rainbow chart.
A Bitcoin rainbow chart shows the crypto attaining new highs after every halving. The first Bitcoin halving took place in 2012 and another halving happened in 2016. The most recent Bitcoin halving happened in May 2020 and the next is expected in 2024.
