Is the Oil Rig Count Dragging US Oil Production?
Last week, the oil rig count fell by three to 802—the lowest level since March 30.
May 21 2019, Published 8:15 a.m. ET

Oil rig count
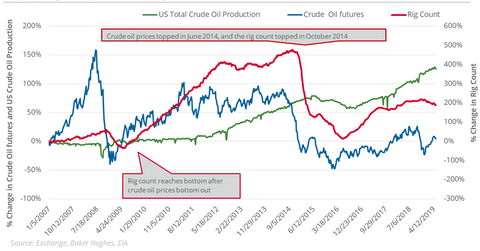
Last week, the oil rig count fell by three to 802—the lowest level since March 30. The rig count tends to follow US crude oil prices with a three to six-month lag.
In February 2016, US crude oil prices fell to the lowest closing level in 12 years. Between February 11, 2016, and May 20, 2019, US crude oil active futures rose 140.7%. The oil rig count reached a 6.5-year low of 316 in May 2016. Between May 27, 2016, and May 17, 2019, the oil rig count rose ~153.8%. Between May 27, 2016, and May 10, 2018, US crude oil production rose ~38.5%.
Impact on US crude oil production and oilfield services stocks
On October 3, US crude oil active futures settled at $76.41 per barrel—the highest closing level since November 21, 2014. Based on the pattern we saw above, the oil rig count could keep rising until at least March. In the current quarter, the US crude oil production growth rate might reverse course. US crude oil production fell by 187,000 barrels per day in February on a month-over-month basis for the second consecutive month, based on the U.S. Energy Information Administration’s “Monthly Oil Production” report released on April 30.
In the week ending November 16, the oil rig count was at 888—the highest level since March 2015. In the week ending May 10, US crude oil production was 12.1 MMbpd (million barrels per day)—the second consecutive weekly decline. With the lower oil rig count, US crude oil production might continue to fall.
Since the US oil rig count hit a multiyear high on November 16, the VanEck Vectors Oil Services ETF (OIH) has fallen 22%. Schlumberger (SLB), Halliburton (HAL), and Transocean (RIG) have fallen 18.9%, 22.7%, and 24%, respectively. OIH has 44% exposure to these stocks. Any slowdown in US oil drilling activities could be a concern for these stocks.
