Utilities’ PPI Could Increase with Higher Natural Gas Prices
On March 3, 2016, natural gas active futures were at the lowest closing level in the last 17 years.
Nov. 19 2018, Published 8:17 a.m. ET

Utilities’ PPI
In 2017, natural gas accounted for 32% of the US electricity generation by energy sources, based on the EIA data. In the previous part, we discussed the rise in natural gas usage in the electric power sector.
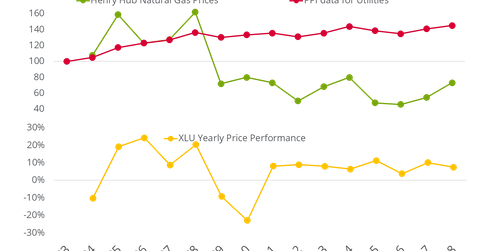
The above graph shows how natural gas prices impacted the PPI (producer price index) data for utilities. The PPI for utilities fell in 2015 and 2016 compared to 2014. The fall coincided with the fall in natural gas prices during this period. A similar trend was observed in 2012.
On March 3, 2016, natural gas active futures were at the lowest closing level in the last 17 years. Higher natural gas production from US shale regions and a warmer winter after 2013–2014 might have been behind the fall in average natural gas prices in 2015 and 2016.
With the rise in natural gas prices between 2012 and 2014, the Utilities Select Sector SPDR Fund’s (XLU) yearly returns also declined.
