Understanding Illumina’s Gross Margin Trend
Illumina’s cost of product revenue increased from $173.0 million in the third quarter of 2017 to $184.0 million in the third quarter of 2018.
Nov. 30 2018, Updated 12:01 p.m. ET

Gross margin
Illumina’s (ILMN) total cost of revenue, consisting of product revenue costs, service costs, and other revenue and amortization related to acquired intangible assets increased from $232.0 million in the third quarter of 2017 to $256.0 million in the third quarter of 2018.
Illumina’s cost of product revenue increased from $173.0 million in the third quarter of 2017 to $184.0 million in the third quarter of 2018. Its cost of service and other revenue increased from $50.0 million in the third quarter of 2017 to $62.0 million in the third quarter of 2018. Its amortization of acquired intangible assets increased from $9.0 million in the third quarter of 2017 to $10.0 million in the third quarter of 2018.
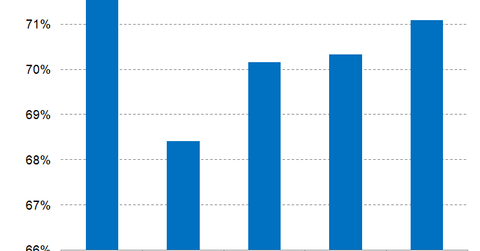
Illumina’s gross profit grew from $482.0 million in the third quarter of 2017 to $597.0 million in the third quarter of 2018. Its gross margin expanded from 68.8% in the third quarter of 2017 to 71.16% in the third quarter of 2018 due to a higher share of consumables, which fetch higher margins on total revenue.
Expected trend
For 2018 and 2019, Illumina’s gross margins are expected to be 70.16% and 70.33%, respectively, compared to its gross margin of 68.42% in 2017.
In comparison, the 2018 gross margins of peers Danaher (DHR), Thermo Fisher Scientific (TMO), and Waters Corporation (WAT) are expected to be 56.04%, 47.07%, and 58.95%, respectively.
We’ll take a look at Illumina’s operational performance in the next article.
