Kansas City Southern: Lowest Gainer in Week 41 Rail Traffic
In Week 41, Kansas City Southern (KSU) posted a 2.4% YoY (year-over-year) decline in carload traffic.
Nov. 20 2020, Updated 1:41 p.m. ET

KSU’s carload traffic in Week 41
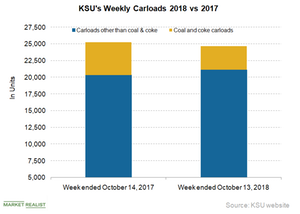
Kansas City Southern (KSU) is the smallest Class I railroad with a railroad network spread in Mexico. In Week 41, KSU posted a 2.4% YoY (year-over-year) decline in carload traffic. It hauled ~24,700 railcars sans intermodal units in the week compared to ~25,300 units in Week 41 of 2017. Compared with the 0.4% YoY growth posted by US railroads, the smallest Class I railroad’s carloads trended in reverse direction in the week.
Kansas City Southern’s carload traffic loss was the second-highest among all Class I railroads. Union Pacific (UNP) and Norfolk Southern (NSC) also reported lower YoY carload traffic in Week 41. Canadian National Railway (CNI) with 5.7% YoY carload gains in Week 41 was the top gainer among all Class I railroads.
Commodities sans coal and coke carloads made up 85.6% of KSU’s total carload traffic in Week 41. Coal and coke railcars made up 14.4% of total carloads. Commodities excluding coal and coke reported 3.8% YoY traffic growth in the week to ~21,100 railcars from ~20,300 units in Week 41 of 2017. Coal and coke traffic declined ~28.1% YoY in the week to ~3,600 railcars from ~4,900 units.
Changes in KSU’s carload commodity groups
These carload commodity groups posted shipment growth in Week 41:
- grain
- crushed stone, sand, and gravel
- food and kindred products
These carload commodity groups posted lower volumes in Week 41:
- pulp, paper, and allied products
- chemicals and allied products
- petroleum products
- stone, clay, and glass products
- metals and products
- motor vehicles and equipment
KSU’s intermodal traffic
Kansas City Southern had a 3.6% YoY intermodal volume growth in Week 41. It hauled ~22,300 containers and trailers in the week compared to ~21,600 units in the same week in 2017. KSU’s container traffic grew ~3.5% YoY to ~22,000 units in the week from ~21,300 units. Its trailer volume rose 7.5% YoY to 328 units from 305 units.
Kansas City Southern’s 0.3% YoY rail traffic (XTN) growth in Week 41 was much lower than the 1.7% gains by US railroads.
Next, let’s take a close look at Canadian National Railway’s rail traffic.
