What Devon Energy’s Technical Indicators Tell Us
Devon Energy (DVN) continues to trade below its short-term (50-day) moving average.
Sept. 28 2018, Updated 3:55 p.m. ET

Devon Energy’s moving averages
Devon Energy (DVN) continues to trade below its short-term (50-day) moving average. It was trading 6.2% below its 50-day SMA (simple moving average) and 0.8% above its 200-day SMA as of September 26. The 200-day SMA should act as a support for DVN. In comparison, DVN’s peers Anadarko Petroleum (APC) and EOG Resources (EOG) were trading 0.8% and 5.3%, respectively, above their 200-day SMAs.
Devon Energy is trading below its 50-day SMA despite the recent gains in crude oil and natural gas prices. That indicates a bearish sentiment in the stock. A weakness in crude oil and natural gas prices could push DVN below its 200-day SMA, resulting in more bearish sentiment. On the other hand, a positive earnings surprise and corporate action might be required to drive positive sentiment in DVN stock.
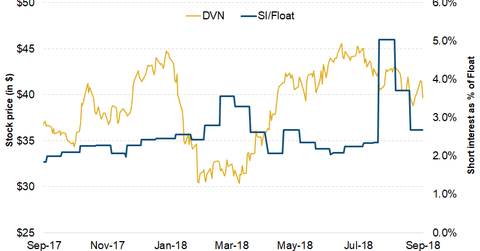
Short interest in Devon Energy
Short interest in Devon Energy was 13.6 million shares as of September 26. At the same time, short interest in DVN as a percentage of float ratio was 2.7%. The current short interest in DVN is lower than the 30-day average of 3.89%. That might indicate a bullish sentiment in the stock. However, it’s slightly higher than the last one-year average of 2.6%. The recent decline in short interest indicates a decrease in open short positions that have not been closed. A decrease in DVN’s short position amid the recent weakness indicates the market expectation that the stock will rise.
In the next part of this series, we’ll look at Devon Energy’s seven-day price forecast based on its implied volatility.
