How Have Apple’s Profit Margins Improved since 2015?
Apple’s operating expenses increased at a three-year CAGR of 14.0% to $26.8 billion in 2017.
Sept. 27 2018, Updated 9:01 a.m. ET

What drove Apple’s gross margin?
Apple’s (AAPL) gross profit increased at a three-year CAGR (compound annual growth rate) of 8.0% in 2017. Apple’s net sales and cost of sales trends translated into gross profit growth of 33.0% in 2015 followed by a 10.0% decline in 2016. The decrease in the cost of sales for 2016 had partially negated the effect of the reduction in net sales on its gross profit.
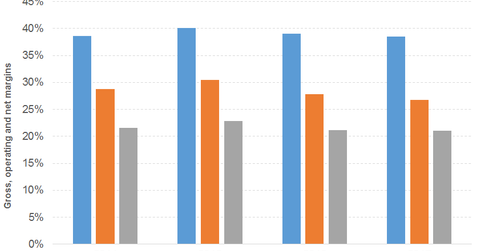
Apple’s gross profit grew by 5.0% to $88.2 billion in 2017 following slower net sales growth. Its gross margin decreased slightly from 39.0%–40.0% between 2014 and 2016 to 38.0% in 2017.
How have the operating and net margins of Apple grown?
Apple’s operating expenses increased at a three-year CAGR of 14.0% to $26.8 billion in 2017. Its expenditures rose by 24.0% in 2015 followed by 8.0% and 11.0% growth in 2016 and 2017, respectively.
Its R&D (research and development) expenses drove the increase in expenses, followed by its SG&A (selling, general, and administrative) expenses. The company’s expenditures comprised 10.0% of its net sales in 2014 and 2015. Its expenditures comprised 11.0% and 12.0% of its net sales in 2016 and 2017, respectively.
Operating and non-operating income
Apple’s operating income grew at a three-year CAGR of 5.0% in 2017. Its net sales and gross profit growth in 2015 led to a 36.0% increase in operating income. However, its operating income declined by 16.0% in 2016 due to the decline in its net sales and gross profit coupled with rising operating expenses.
Apple’s operating income improved by 2.0% in 2017 to $61.3 billion due to lower net sales and gross profit growth as well as higher operating expenses. The company’s operating margin increased from 29.0% in 2014 to 30.0% in 2015. Its operating margin decreased to 28.0% and 27.0% in 2016 and 2017, respectively.
Apple’s non-operating income totaled 1.0% of net sales during this timeframe. Apple’s net income grew by 35.0% in 2015 before declining 14.0% in 2016, driven by its net sales, gross profit, and operating income trends. Its net income improved by 6.0% in 2017.
The company’s net income increased at a three-year CAGR of 7.0% to $48.4 billion in 2017. Its net margin declined from 22.0%–23.0% in 2014 and 2015 to 21.0% in both 2016 and 2017.
Apple’s EPS improved at a three-year CAGR of 13.0% to $9.20 in 2017. Its EPS increased by 43.0% in 2015 before declining by 10.0% in 2016. Its EPS improved by 11.0% in 2017, and the company’s share buybacks have enhanced its EPS numbers.
Facebook (FB) and Alphabet (GOOG) had respective gross margins of 87.0% and 59.0% in 2017. Apple, Amazon (AMZN), and Netflix (NFLX) had gross margins of 38.0%, 37.0%, and 34.0%, respectively, in 2017.
